
Mathematics, 04.03.2020 23:35 palcochran1313
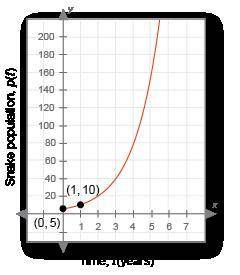
Below is the graph of the boa constrictor population you learned about in the video. The x-axis is t, the time in years, and the y-axis is p(t), the snake population for any given year. In this case, t = 0 indicates the year they started keeping track of the constrictor population. Scientists want to know how the population is changing every two years so they can make predictions about the future.
The graph is of a function in the form p(t) = a • bt. What is the function?

Answers: 1


Other questions on the subject: Mathematics
Mathematics, 21.06.2019 13:00, smortandsons
(98 points) i need with 5 questions. answer definitions are welcomed, but not necessary.
Answers: 3
Mathematics, 21.06.2019 19:10, madimocaj
Angle xyz is formed by segments xy and yz on the coordinate grid below: a coordinate plane is shown. angle xyz has endpoints at 3 comma negative 1 and 6 negative 2 and 3 comma negative 3 and measures 36.87 degrees. angle xyz is rotated 270 degrees counterclockwise about the origin to form angle x′y′z′. which statement shows the measure of angle x′y′z′?
Answers: 2
You know the right answer?
Below is the graph of the boa constrictor population you learned about in the video. The x-axis is t...
Questions in other subjects:


Mathematics, 03.12.2019 10:31
History, 03.12.2019 10:31

English, 03.12.2019 10:31


