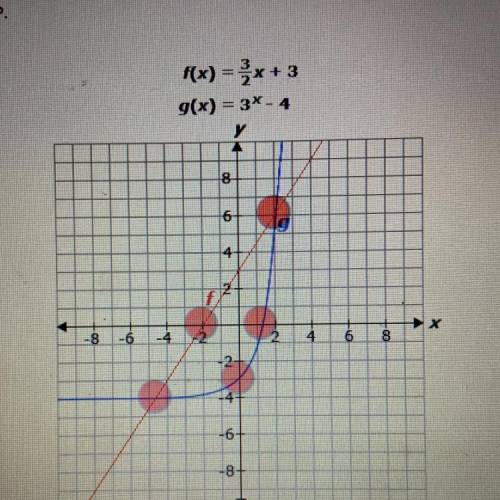
Select the correct location on the graph.
Jared is studying the two functions, f and g,...

Mathematics, 04.03.2020 01:30 juan3937
Select the correct location on the graph.
Jared is studying the two functions, f and g, graphed below. He correctly states that for all x-values to the right of point P, g(x) > f(x). Select the point on the graph which could be point P.

Answers: 2


Other questions on the subject: Mathematics
Mathematics, 21.06.2019 19:00, 592400014353
The test scores of 32 students are listed below. construct a boxplot for the data set and include the values of the 5-number summary. 32 37 41 44 46 48 53 55 57 57 59 63 65 66 68 69 70 71 74 74 75 77 78 79 81 82 83 86 89 92 95 99
Answers: 1
Mathematics, 22.06.2019 02:30, QueenNerdy889
Which statement best explains whether the table represents a linear or nonlinear function? input (x) output (y) 2 5 4 10 6 15 8 20 it is a linear function because the input values are increasing. it is a nonlinear function because the output values are increasing. it is a linear function because there is a constant rate of change in both the input and output. it is a nonlinear function because there is a constant rate of change in both the input and output.
Answers: 3
Mathematics, 22.06.2019 05:00, FlayMaster101
Hi i need i need to get all a’s and i really need some
Answers: 1
You know the right answer?
Questions in other subjects:
Mathematics, 28.11.2021 05:40

History, 28.11.2021 05:40
Mathematics, 28.11.2021 05:40
Mathematics, 28.11.2021 05:40

Biology, 28.11.2021 05:40

Social Studies, 28.11.2021 05:40
Mathematics, 28.11.2021 05:40

Physics, 28.11.2021 05:40
Mathematics, 28.11.2021 05:40


