
Mathematics, 03.03.2020 00:51 maxi12312345
The following data comparing wait times at two rides at Disney are listed below: Position Pirates Splash Mountain Sample Size 32 30 Average Wait Time (In Minutes) 14.68 18.77 Population Standard Deviation 11.87 16.79 What is the 98% confidence interval for the difference in wait times between pirates and splash mountain? What is the test statistic for testing to see if there is a significant difference in wait times between pirates and splash mountain?

Answers: 3


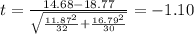
 represent the mean for Pirates
 represent the mean for Splash Mountain
 represent the sample standard deviation for the sample Pirates
 represent the sample standard deviation for the sample Slpash Mountain
 sample size selected for Pirates
 sample size selected for Splash Mountain
 represent the significance level for the hypothesis test.
 represent the p value for the test (variable of interest)
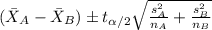

 and
and  , we can find in the t distribution with df =60 a critical value that accumulates 0.01 of the area on each tail and we got:


 (1)
(1)


Other questions on the subject: Mathematics
Mathematics, 21.06.2019 19:00, niquermonroeee
Human body temperatures have a mean of 98.20° f and a standard deviation of 0.62°. sally's temperature can be described by z = 1.4. what is her temperature? round your answer to the nearest hundredth. 99.07°f 97.33°f 99.60°f 100.45°f
Answers: 1
Mathematics, 21.06.2019 20:00, genyjoannerubiera
The weight v of an object on venus varies directly with its weight e on earth. a person weighing 120 lb on earth would weigh 106 lb on venus. how much would a person weighing 150 lb on earth weigh on venus?
Answers: 2
Mathematics, 21.06.2019 20:30, kjhgfcvb5761
Solve each quadratic equation by factoring and using the zero product property. [tex]x^2+6x+8=0[/tex]
Answers: 2
Mathematics, 22.06.2019 00:00, chiliboy8394
Layla answer 21 of the 25 questions on his history test correctly. what decimal represents the fraction of problem he answer incorrectly.
Answers: 1
You know the right answer?
The following data comparing wait times at two rides at Disney are listed below: Position Pirates Sp...
Questions in other subjects:
Mathematics, 19.07.2020 01:01


History, 19.07.2020 01:01
Mathematics, 19.07.2020 01:01
Mathematics, 19.07.2020 01:01
Mathematics, 19.07.2020 01:01
Mathematics, 19.07.2020 01:01


