
Mathematics, 02.03.2020 23:07 chefjones06p0gvlh
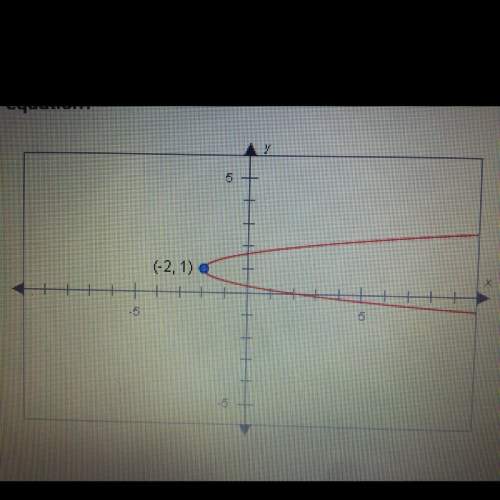
Which graph shows the solution to the equation below? Log3(x+3) = log 0.3(x-1)

Answers: 3


Other questions on the subject: Mathematics
Mathematics, 21.06.2019 18:00, mooreadrian412
The brain volumes (cm cubed) of 50 brains vary from a low of 904 cm cubed to a high of 1488 cm cubed. use the range rule of thumb to estimate the standard deviation s and compare the result to the exact standard deviation of 175.5 cm cubed, assuming the estimate is accurate if it is within 15 cm cubed
Answers: 2
Mathematics, 21.06.2019 20:30, jmcd10
Create a question with this scenario you could ask that could be answered only by graphing or using logarithm. david estimated he had about 20 fish in his pond. a year later, there were about 1.5 times as many fish. the year after that, the number of fish increased by a factor of 1.5 again. the number of fish is modeled by f(x)=20(1.5)^x.
Answers: 1
Mathematics, 22.06.2019 01:00, kat1357
You have just applied, and have been approved for a $58,000 mortgage. the rate quoted to you by the lender is 6.1% for a 30 year fixed mortgage. determine how much of your third month’s payment goes towards the principal. $56.65 $56.93 $57.22 $57.51
Answers: 2
You know the right answer?
Which graph shows the solution to the equation below? Log3(x+3) = log 0.3(x-1)...
Questions in other subjects:

History, 10.10.2019 00:00

Mathematics, 10.10.2019 00:00

Mathematics, 10.10.2019 00:00
English, 10.10.2019 00:00


