
Mathematics, 02.03.2020 22:45 pineapplepizaaaaa
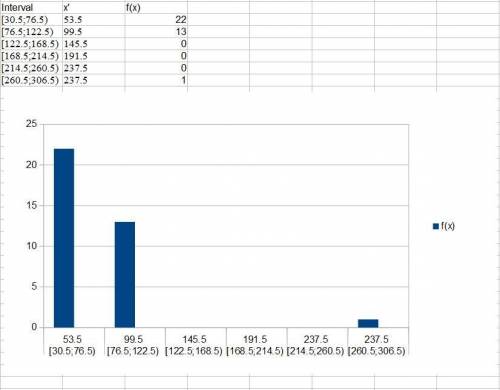
The following data represent salaries, in thousands of dollars, for employees of a small company. Notice the data have been sorted in increasing order.
54 55 55 57 57 59 60 65 65 65 66 68 68 69 69 70 70 70 75 75 75 75 77 82 82 82 88 89 89 91 91 97 98 98 98 280
Make a histogram using the class boundaries 53.5, 99.5, 145.5, 191.5, 237.5, 283.5.

Answers: 1


Other questions on the subject: Mathematics
Mathematics, 21.06.2019 14:00, pmdare2551
The deck that kenneth is building is in the shape of a parallelogram abcd the measure of angle c is one third the measure of angle b find the measure of each angle of the deck
Answers: 2
Mathematics, 21.06.2019 21:50, bcox32314
Desmond wants to sell his car that he paid $8,000 for 2 years ago. the car depreciated, or decreased in value, at a constant rate each month over a 2-year period. if x represents the monthly depreciation amount, which expression shows how much desmond can sell his car for today? \ 8,000 + 24x 8,000 - 24x 8,000 + 2x 8,000 - 2x
Answers: 3
You know the right answer?
The following data represent salaries, in thousands of dollars, for employees of a small company. No...
Questions in other subjects:

English, 01.02.2021 08:40
Mathematics, 01.02.2021 08:40
English, 01.02.2021 08:40
Mathematics, 01.02.2021 08:40
Mathematics, 01.02.2021 08:40
Mathematics, 01.02.2021 08:40


