
Mathematics, 02.03.2020 03:42 datboyjulio21
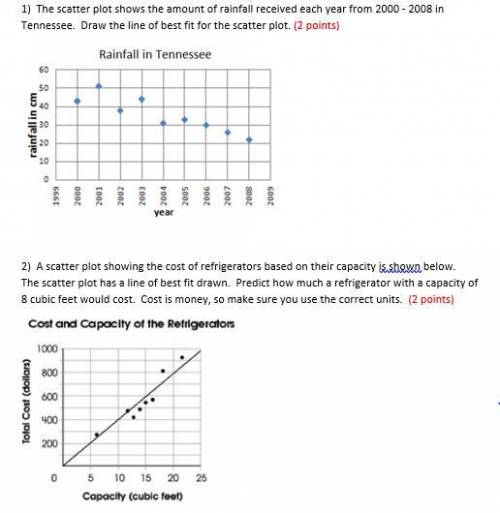
1) The scatter plot shows the amount of rainfall received each year from 2000 - 2008 in Tennessee. Draw the line of best fit for the scatter plot.
2) A scatter plot showing the cost of refrigerators based on their capacity is shown below. The scatter plot has a line of best fit drawn. Predict how much a refrigerator with a capacity of 8 cubic feet would cost. Cost is money, so make sure you use the correct units.
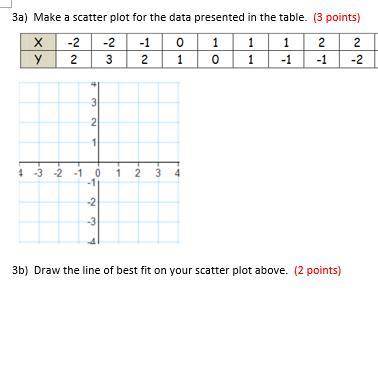
3a) Make a scatter plot for the data presented in the table
3b) Draw the line of best fit on your scatter plot above.

Answers: 1


Other questions on the subject: Mathematics
Mathematics, 21.06.2019 12:30, destinymitchell966
What are the domain and range of f(x)=[1/5]x
Answers: 1
Mathematics, 21.06.2019 13:00, HaJEReMY5170
Solve the system by the elimination method. 3x - 2y - 7 = 0 5x + y - 3 = 0 to eliminate y, the lcm is 2. which of the following is the resulting equations? 1.3x - 2y - 7 = 0 5x + y - 3 = 0 2.3x - 2y - 7 = 0 -10x - 2y + 6 = 0 3.3x - 2y - 7 = 0 10x + 2y - 6 = 0
Answers: 1
Mathematics, 21.06.2019 13:30, chriscendypierre56
At dinner, 2/5 of the people had fish and 1/3 had chicken. if everyone else had lamb, what fraction of the people had lamb? and if 40 people had lamb , calculate the total number of people at the dinner.
Answers: 1
You know the right answer?
1) The scatter plot shows the amount of rainfall received each year from 2000 - 2008 in Tennessee. D...
Questions in other subjects:

Mathematics, 04.12.2020 18:50

Chemistry, 04.12.2020 18:50
Biology, 04.12.2020 18:50

Physics, 04.12.2020 18:50

History, 04.12.2020 18:50


