
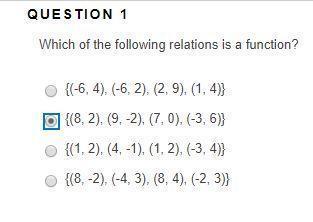
Mathematics, 29.02.2020 21:06 averagegirl27
Sample Stock Index (2008–2013) A graph titled Sample Stock Index from 2008 to 2013 has year on the x-axis and Index level on the y-axis, from 6,000 to 15,000 in increments of 3,000. In 2008, the index level decreased until it reached the lowest point in 2009. In 2009, the index level began to rise steadily through 2013. Which conclusions can be made about the growth of the economy? Check all that apply. Aggregate demand increased after 2009. Aggregate demand increased between 2010 and 2011. The economy remained stable in 2008. The economy experienced a sharp drop in growth between 2008 and 2009. The economy grew weaker after a crash in 2010.

Answers: 3


Other questions on the subject: Mathematics
Mathematics, 21.06.2019 17:40, JordanJones04402
Given f(x)= 9x+1 and g(x)=x^3, choose the expression (f*g)(x)
Answers: 2
Mathematics, 21.06.2019 20:30, destinyharris8502
I’m on question 7 it says a covered water tank is in the shape of a cylinder the tank has a 28 inch diameter and a height of 66 inches to the nearest square inch what is the surface area of the water tank
Answers: 2
You know the right answer?
Sample Stock Index (2008–2013) A graph titled Sample Stock Index from 2008 to 2013 has year on the x...
Questions in other subjects:


Biology, 29.05.2021 01:00


Computers and Technology, 29.05.2021 01:00
Biology, 29.05.2021 01:00

Arts, 29.05.2021 01:00
History, 29.05.2021 01:00


