
The two graphs show amounts of bacteria over time for two different strains of bacteria.
The c...

Mathematics, 29.02.2020 05:19 pinapunapula
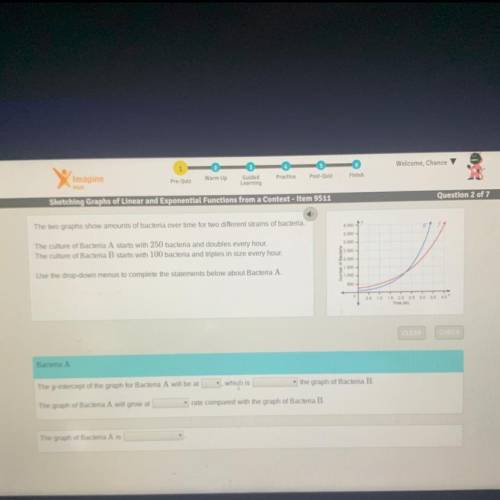
The two graphs show amounts of bacteria over time for two different strains of bacteria.
The culture of Bacteria A starts with 250 bacteria and doubles every hour.
The culture of Bacteria B starts with 100 bacteria and triples in size every hour.
Use the drop-down menus to complete the statements below about Bacteria A.

Answers: 3


Other questions on the subject: Mathematics
Mathematics, 21.06.2019 16:10, DepressionCentral
Which of the following graphs represents the function f(x) = 2^x
Answers: 2
Mathematics, 21.06.2019 20:30, corbeansbrain
Someone answer asap for ! michele pushes a box d meters across a floor. she uses a force f, in newtons, to push the box. she pushes the box for t seconds. the formula p = fd/t calculates the power, p, in watts, that it takes for michele to complete the task. solve the formula for d.
Answers: 2
You know the right answer?
Questions in other subjects:


English, 05.05.2020 02:32

English, 05.05.2020 02:32
Mathematics, 05.05.2020 02:32


