PLEASE ANSWER
The graph shows the heights, y (in centimeters), of a plant after a certai...

Mathematics, 29.02.2020 04:18 hanjonez
PLEASE ANSWER
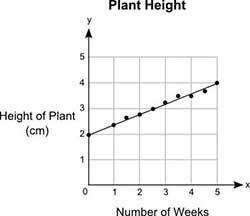
The graph shows the heights, y (in centimeters), of a plant after a certain number of weeks, x. Linda drew the line of best fit on the graph.
Find the slope and y-intercept of the line to help calculate the approximate height of the plant. After 7 weeks, how tall is the plant?
A. 4.8 centimeters
B. 14.4 centimeters
C. 16.5 centimeters
D. 19.5 centimeters

Answers: 1


Other questions on the subject: Mathematics
Mathematics, 21.06.2019 19:30, ginocousins06
Fa bus driver leaves her first stop by 7: 00 a. m., her route will take less than 37 minutes. if she leaves after 7: 00 a. m., she estimates that the same route will take no less than 42 minutes. which inequality represents the time it takes to drive the route, r?
Answers: 3
Mathematics, 21.06.2019 19:50, itsmariahu1927
Which statement is true? n is a point of tangency on circle p. pt is a secant of circle p. is a secant of circle p. vu is a tangent of circle p.
Answers: 3
You know the right answer?
Questions in other subjects:

Social Studies, 22.07.2019 03:20

Chemistry, 22.07.2019 03:20

History, 22.07.2019 03:20
History, 22.07.2019 03:20
Mathematics, 22.07.2019 03:20


English, 22.07.2019 03:20


