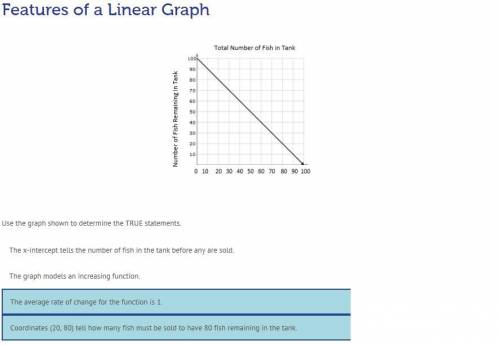
Use the graph shown to determine the TRUE statements.
The x-intercept tells the number...

Mathematics, 28.02.2020 20:51 jarviantemelton
Use the graph shown to determine the TRUE statements.
The x-intercept tells the number of fish in the tank before any are sold.
The graph models an increasing function.
The average rate of change for the function is 1.
Coordinates (20, 80) tell how many fish must be sold to have 80 fish remaining in the tank.

Answers: 3


Other questions on the subject: Mathematics
Mathematics, 21.06.2019 19:30, gabby77778
[15 points]find the least common multiple of the expressions: 1. 3x^2, 6x - 18 2. 5x, 5x(x +2) 3. x^2 - 9, x + 3 4. x^2 - 3x - 10, x + 2 explain if possible
Answers: 3
Mathematics, 21.06.2019 20:40, mruffier6239
In a 45-45-90 right triangle, what is the ratio of the length of one leg to the length of the other leg? а . 1: 2 в. 2: 1 с. 2: 1 d. 1: 1
Answers: 1
Mathematics, 21.06.2019 22:10, Jenifermorales101
Write the function for the graph. (1.8) (0,4)
Answers: 3
Mathematics, 21.06.2019 23:30, odellbeckham7171
When a valve is open 281 gallons of water go through it in one hour the number of gallons that would go through in 94 hours is
Answers: 1
You know the right answer?
Questions in other subjects:


