
Mathematics, 27.02.2020 18:30 wdgyvwyv8840
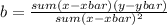
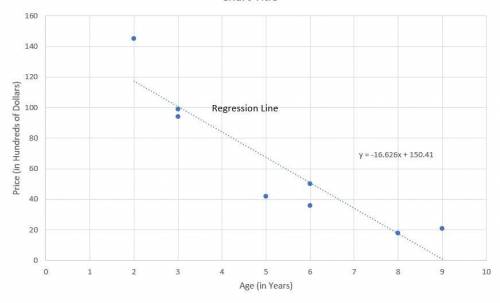
An auto manufacturing company wanted to investigate how the price of one of its car models depreciates with age. The research department at the company took a sample of eight cars of this model and collected the following information on the ages (in years) and prices(in hundreds of dollars) of these carsAge 8 3 6 9 2 5 6 3Price 18 94 50 21 145 42 36 99(a) Find the regression line with price as a dependent variable and age as an independent variable.(b) Predict the price of a 7 year old car of this model.(c) Estimate the price of an 18 year old car of this model.

Answers: 3


Other questions on the subject: Mathematics
Mathematics, 21.06.2019 13:00, innocentman69
You are constructing a histogram for scores that range from 70 to 100 in whole points. frequencies range from 3 to 10; that is, every whole-point score between 60 and 100 occurs at least 3 times, and at least one score occurs 10 times. which of these would probably be the best range and size for the score intervals along the x-axis?
Answers: 1
Mathematics, 21.06.2019 17:00, SillyEve
In tossing one coin 10 times, what are your chances for tossing a head? a tail? 2. in tossing one coin 100 times, what are your chances for tossing a head? a tail? 3. in tossing one coin 200 times, what are your chances for tossing a head? a tail? deviation = ((absolute value of the difference between expected heads and observed heads) + (absolute value of the difference between expected tails and observed tails)) divided by total number of tosses. this value should always be positive. 4. what is the deviation for 10 tosses? 5. what is the deviation for the 100 tosses? 6. what is the deviation for 200 tosses? 7. how does increasing the total number of coin tosses from 10 to 100 affect the deviation? 8. how does increasing the total number of tosses from 100 to 200 affect the deviation? 9. what two important probability principles were established in this exercise? 10. the percent of occurrence is the obtained results divided by the total tosses and multiplied by 100%. toss the coins 100 times and record your results. calculate the percent occurrence for each combination. percent head-head occurrence: percent tail-tail occurrence: percent head-tail occurrence:
Answers: 3
You know the right answer?
An auto manufacturing company wanted to investigate how the price of one of its car models depreciat...
Questions in other subjects:
Mathematics, 18.03.2020 23:52


Social Studies, 18.03.2020 23:52

Mathematics, 18.03.2020 23:52
Mathematics, 18.03.2020 23:53

Mathematics, 18.03.2020 23:53


