
Mathematics, 27.02.2020 16:33 niyag2gi
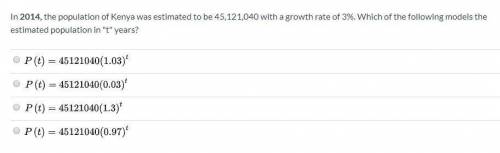
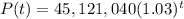
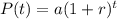
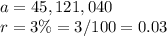
In 2014, the population of Kenya was estimated to be 45,121,040 with a growth rate of 3%. Which of the following models the estimated population in "t" years?

Answers: 1


Other questions on the subject: Mathematics
Mathematics, 21.06.2019 17:10, jonathan3191
Empty box + box + empty box fill in the box is equal to 30 how
Answers: 2
You know the right answer?
In 2014, the population of Kenya was estimated to be 45,121,040 with a growth rate of 3%. Which of t...
Questions in other subjects:


Computers and Technology, 19.11.2019 05:31


