
Mathematics, 26.02.2020 20:45 jbismyhusbandbae
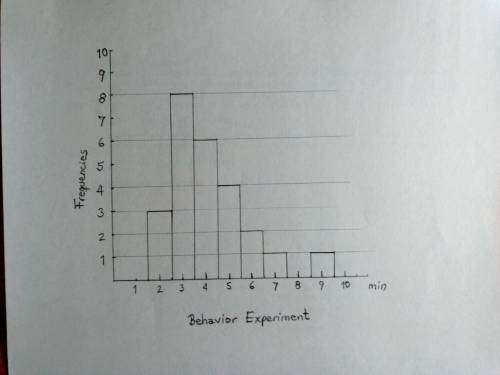
The histogram below shows the distribution of times, in minutes, required for 25 rats in an animal behavior experiment to navigate a maze successfully. The histogram has 8 intervals, each with a width of 1 minute and with midpoints at 2, 3, 4, ..., and 9 minutes. The frequencies are 3, 8, 6, 4, 2, 1, 0, and 1.To describe the center and spread of the above distribution, the appropriate numerical measures are:a. the mean and the standard deviationb. the mean and the medianc. the median and the IQRd. the IQR and the standard deviatione. Any of the above would be appropriate, it is just a matter of taste.

Answers: 1


Other questions on the subject: Mathematics
Mathematics, 21.06.2019 15:30, elizabethburkha
Determine whether the set of whole numbers is closed under addition. explain why the set is or is not closed. give an example.
Answers: 1
Mathematics, 21.06.2019 22:30, kpopqueen0
Will mark brainlist what is the slope of the line passing through the points (-2, -8) and (-3,-9)? -7/5-5/71-1
Answers: 2
Mathematics, 21.06.2019 23:00, karyme12
I'm at a bookstore with $\$35$ in my pocket and a $20\%$-off coupon. what is the cost of the most expensive book i can buy with my money and the coupon? (assume that there are books of every possible price in the bookstore. it's a large bookstore! )
Answers: 1
You know the right answer?
The histogram below shows the distribution of times, in minutes, required for 25 rats in an animal b...
Questions in other subjects:
Mathematics, 06.02.2022 18:10
Mathematics, 06.02.2022 18:10
Mathematics, 06.02.2022 18:10

Mathematics, 06.02.2022 18:10
Mathematics, 06.02.2022 18:20

History, 06.02.2022 18:20

Health, 06.02.2022 18:20


