PLEASE ANSWER
Mrs. Mallory and Mrs. Bodine collected data on the science and math final...

Mathematics, 26.02.2020 19:26 areanna02
PLEASE ANSWER
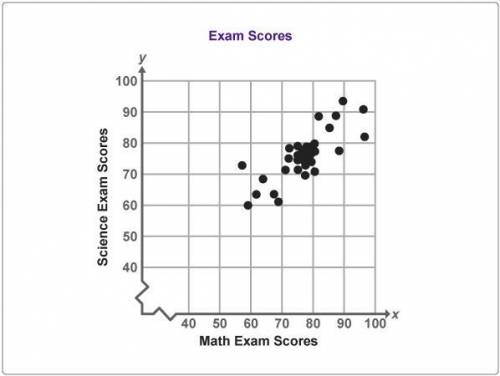
Mrs. Mallory and Mrs. Bodine collected data on the science and math final exam scores for a group of students.
What is the best explanation for the cluster of students shown on the graph?
A. No students scored above 90 on both exams.
B. One student scored exactly 60 on both exams.
C. All the students scored between 60 and 100 on both exams.
D. More than half the students scored between 70 and 80 on both exams.

Answers: 1


Other questions on the subject: Mathematics
Mathematics, 21.06.2019 18:00, safi30360oz0c34
Based on the graph, what is the initial value of the linear relationship? a coordinate plane is shown. a line passes through the y-axis at -2 and the x-axis at 3.
Answers: 3
You know the right answer?
Questions in other subjects:
Mathematics, 14.10.2019 16:30

History, 14.10.2019 16:30
Mathematics, 14.10.2019 16:30

Spanish, 14.10.2019 16:30


Mathematics, 14.10.2019 16:30


