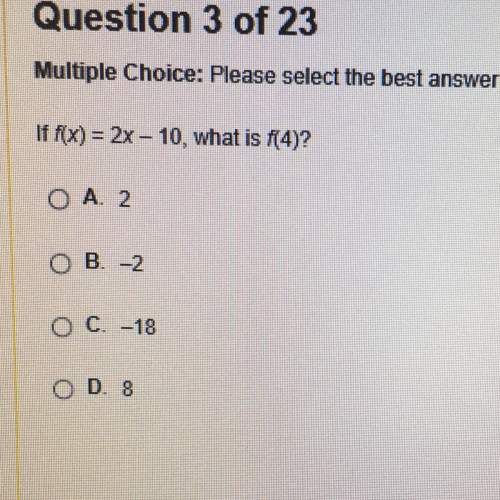
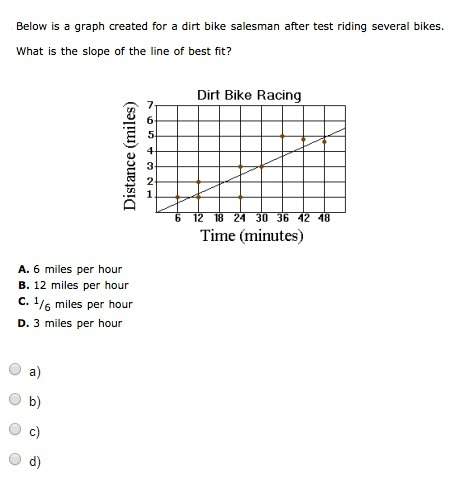
Which scatterplot shows the strongest relationship between the variable x and the variable y?
...

Mathematics, 26.02.2020 18:29 gabiii262
Which scatterplot shows the strongest relationship between the variable x and the variable y?
a. On a graph, points are grouped close together and decrease.
b. On a graph, points are scattered all over the graph.
c. On a graph, points are scattered all over the graph.
d. On a graph, points are scattered all over the graph.

Answers: 2


Other questions on the subject: Mathematics
Mathematics, 21.06.2019 18:30, Alexandragurule18
Can someone check if i did this correct. it’s number 4 if you’re wondering.
Answers: 1
You know the right answer?
Questions in other subjects:

Mathematics, 23.08.2019 06:30

History, 23.08.2019 06:30
Mathematics, 23.08.2019 06:30
History, 23.08.2019 06:30
Mathematics, 23.08.2019 06:30


