Use the drawing tool(s) to form the correct answer on the provided grid.
Function fis shown on...

Mathematics, 26.02.2020 16:00 mads3499
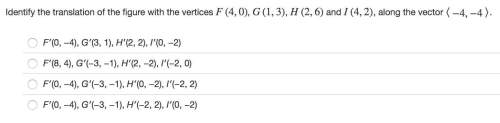
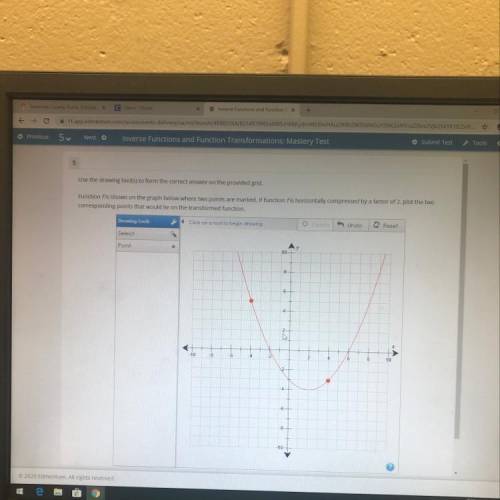
Use the drawing tool(s) to form the correct answer on the provided grid.
Function fis shown on the graph below where two points are marked. If function fis horizontally compressed by a factor of 2. plot the two
corresponding points that would lie on the transformed function.
Drawing Tools
click on a tool to begin drawing
Undo Reset
Select
Point

Answers: 3


Other questions on the subject: Mathematics
Mathematics, 21.06.2019 23:40, preciosakassidy
The frequency table shows the results of a survey asking people how many hours they spend online per week. on a piece of paper, draw a histogram to represent the data. then determine which answer choice matches the histogram you drew. in order here is the.. hours online: 0-3, 4-7, 8-11, 12-15, and 16-19. frequency: 5, 8, 10, 8, 7 answer for the question is in the picture! : )
Answers: 2
You know the right answer?
Questions in other subjects:

Social Studies, 26.07.2019 12:20


Business, 26.07.2019 12:20
Biology, 26.07.2019 12:20

History, 26.07.2019 12:20
Biology, 26.07.2019 12:20


