A frequency table for the 30 best lifetime baseball
batting averages of all time is shown to t...

Mathematics, 26.02.2020 04:40 kookycookiefanx
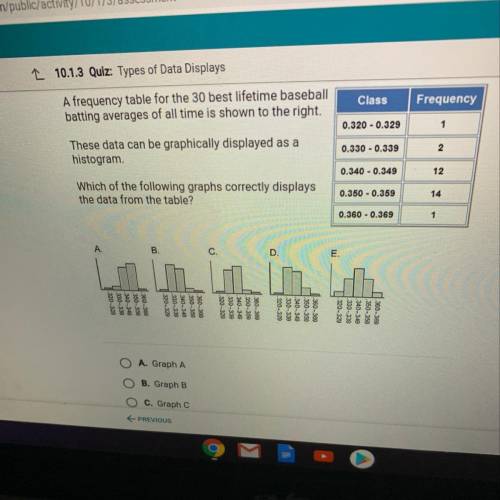
A frequency table for the 30 best lifetime baseball
batting averages of all time is shown to the right.
These data can be graphically displayed as a
histogram.
Which of the following graphs correctly displays
the data from the table?

Answers: 2


Other questions on the subject: Mathematics
Mathematics, 21.06.2019 15:00, rosezgomez97
The radical equation 2+√2x-3 = √x+7 has a solution set [x= a0} and an extraneous root x = a1.
Answers: 3
Mathematics, 21.06.2019 16:30, maycigrimaldi4990
Problem fathi wants to print out a pdf document that is 48 pages long. to save paper, he decides to print on both sides of each sheet and to print two pages on each side of the sheet. how many sheets of paper will he need?
Answers: 3
Mathematics, 21.06.2019 18:00, paigejohnson6161
State if the two triangles are congruent. if they are, state how you know?
Answers: 1
Mathematics, 22.06.2019 03:30, damienlopezram
Miranda drove her car 112 miles on a 4 gallons of gas and 182 miles on 6.5 gallons. how many gallons would she need to drive 420 miles?
Answers: 1
You know the right answer?
Questions in other subjects:

Biology, 20.05.2020 16:57
Mathematics, 20.05.2020 16:57
Mathematics, 20.05.2020 16:57

English, 20.05.2020 16:57
Mathematics, 20.05.2020 16:57
English, 20.05.2020 16:57

Mathematics, 20.05.2020 16:57


