The following data shows wind speed in a city, in miles per hour, on consecutive days
of a mon...

Mathematics, 24.02.2020 17:40 viktoria1198zz
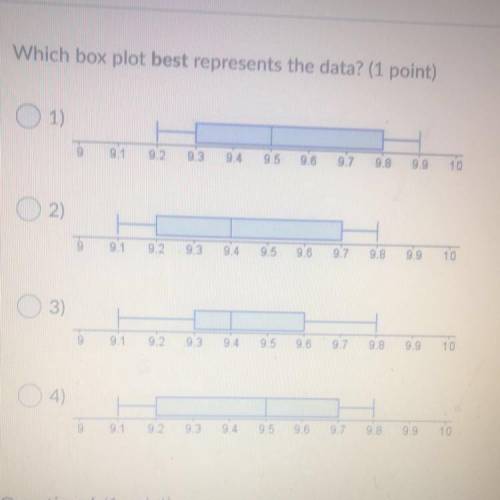
The following data shows wind speed in a city, in miles per hour, on consecutive days
of a month:
9.4,9.2,97,9.8, 9.4,97,9.6, 9.3, 9.2, 9.1,9.4
Which box plot best represents the data?

Answers: 3


Other questions on the subject: Mathematics
Mathematics, 21.06.2019 15:20, angelbabynn05
Abcd ≅ klmn ≅ pqrs ≅ wxyz given that information, which figures are reflections of abcd?
Answers: 1
Mathematics, 21.06.2019 17:00, gomez36495983
() at a farm, animals are fed bales of hay and buckets of gain. each bale of hay is in the shape of a rectangular prism. the base side lengths 2 feet and 3 feet, and the height is 5 feet. each bucket of grain is a cylinder with diameter of 3 feet. the height of the bucket is 5 feet as the height of bale. a. which is larger in area, the rectangular base of the bale or the circular base of the bucket? explain how you know b. which is larger in volume, the bale or the bucket? explain how you know
Answers: 1
Mathematics, 21.06.2019 22:40, katerin3499
Explain in a minimum of 2 sentences how to graph the equation of the absolute value function given a vertex of (-1,3) and a value of “a” equal to ½.
Answers: 2
You know the right answer?
Questions in other subjects:


Mathematics, 05.04.2022 19:20


