Select the correct answer from each drop-down menu.
Which inequality is represented by the gra...

Mathematics, 24.02.2020 05:06 sammybrain
Select the correct answer from each drop-down menu.
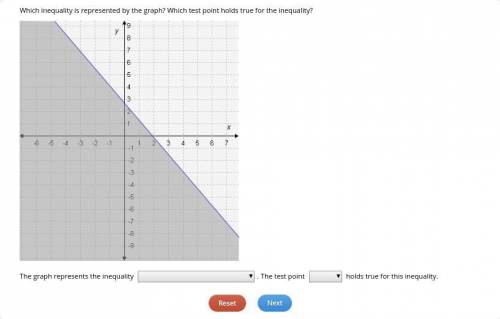
Which inequality is represented by the graph? Which test point holds true for the inequality?
1st drop down: 1. x + 3y is less than or equal to 8, 2. 4x + 3y is greater than or equal to 8, 3. 4x + 3y is less than or equal to 8, 4. 4x + 3y is less than or equal to 12.
2nd drop down: 1. (-1, 4), 2. (0, 3), 3. (1, 4), 4. (2, 1/3).
The graph represents the inequality . The test point holds true for this inequality.

Answers: 2


Other questions on the subject: Mathematics
Mathematics, 21.06.2019 18:30, monyeemonyee12
Find the area of a parallelogram with base 15 yards and height 21 2/3
Answers: 1
Mathematics, 21.06.2019 22:00, joelpimentel
3women sell hats at a craft fair weekly. the money they make at the fair is split into categories. 9% goes to pay taxes. $55 goes to pay rent for the space they sell in. the rest is split between the women. if the group make $706 at the fair, how much does each women get paid once the money is divided
Answers: 1
Mathematics, 21.06.2019 22:00, nyceastcoast
Percent increase and decrease. original number: 45 new number: 18
Answers: 1
You know the right answer?
Questions in other subjects:

History, 18.10.2019 04:50

Biology, 18.10.2019 04:50

Chemistry, 18.10.2019 04:50


Advanced Placement (AP), 18.10.2019 04:50

Business, 18.10.2019 04:50
English, 18.10.2019 04:50
Mathematics, 18.10.2019 04:50
Mathematics, 18.10.2019 04:50


