
Mathematics, 22.02.2020 06:19 jasminebrown72
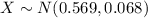
The proportion of traffic fatalities for each U. S. state resulting from drivers with high alcohol blood levels in 1982 was approximately normally distributed, with mean 0.569 and standard deviation 0.068.
a. What proportion of states would you expect to have more than 65% of their traffic fatalities from drunk driving?
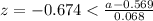
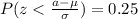
b. What proportion of deaths due to drunk driving would you expect to be at the 25th percentile of this distribution?

Answers: 3


 and
and 


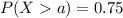 (a)
(a)
 (b)
(b)


Other questions on the subject: Mathematics
Mathematics, 21.06.2019 19:00, ivethzurita0425
{0,1,2,3,4,5,6,20,21,22,23,24,25} the distribution is considered to be: skewed the right, skewed the left, not skewed?
Answers: 1
You know the right answer?
The proportion of traffic fatalities for each U. S. state resulting from drivers with high alcohol b...
Questions in other subjects:


Mathematics, 22.06.2019 02:00


Mathematics, 22.06.2019 02:00


