
Mathematics, 22.02.2020 03:07 peacelillady1030
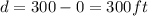
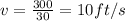
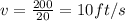
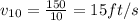
The graph shows the distance of a car from a measuring position located on the edge of a straight road.(a) What was the average velocity of the car from t = 0 to t = 30 seconds?(b) What was the average velocity of the car from t = 10 to t = 30 seconds?(c) About how fast was the car traveling att = 10 seconds? at t = 20 s ? at t = 30 s ? (d) What does the horizontal part of the graph between t = 15 and t = 20 seconds mean?(e) What does the negative velocity at t = 25 represent?

Answers: 3


 corresponds to the displacement, while
  corresponds to the time interval, therefore the slope corresponds to the velocity.
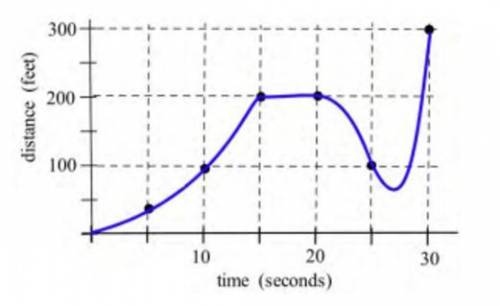


Other questions on the subject: Mathematics
Mathematics, 21.06.2019 20:00, proutyhaylee
Suppose a store sells an average of 80 cases of soda per day. assume that each case contains 24 cans of soda and that the store is open 10 hours per day. find the average number of soda that the store sells per hour.
Answers: 1
Mathematics, 21.06.2019 22:10, Jenifermorales101
Write the function for the graph. (1.8) (0,4)
Answers: 3
Mathematics, 22.06.2019 01:10, abadir2008
Given: ae ≅ ce ; de ≅ be prove: abcd is a parallelogram. we have that ab || dc. by a similar argument used to prove that △aeb ≅ △ced, we can show that △ ≅ △ceb by. so, ∠cad ≅ ∠ by cpctc. therefore, ad || bc by the converse of the theorem. since both pair of opposite sides are parallel, quadrilateral abcd is a parallelogram.
Answers: 3
You know the right answer?
The graph shows the distance of a car from a measuring position located on the edge of a straight ro...
Questions in other subjects:

Mathematics, 30.07.2019 06:40
English, 30.07.2019 06:40
Mathematics, 30.07.2019 06:40
Mathematics, 30.07.2019 06:40


