
Mathematics, 21.02.2020 03:51 thedocgalloway
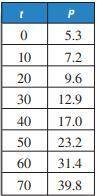
The table shows the population P (in millions) of the United States from 1800 to 1870 where t represents the number of years since 1800.
a. Use a graphing calculator to find an exponential growth
model and a logistic growth model for the data. Then
graph both models.
b. Use the models from part (a) to find the year when the
population was about 92 million. Which of the models gives
a year that is closer to 1910, the correct answer? Explain
why you think that model is more accurate.
c. Use each model to predict the population in 2010. Which
model gives a population closer to 297.7 million, the
predicted population from the U. S. Bureau of the Census?

Answers: 2


Other questions on the subject: Mathematics
Mathematics, 21.06.2019 18:30, isabellacampos4586
It took alice 5 5/6 hours to drive to her grandparents' house for . on the way home, she ran into traffic and it took her 7 3/8 hours. how much longer did the return trip take? write your answer as a proper fraction or mixed number in simplest form. the trip home took __hours longer. ?
Answers: 1
Mathematics, 21.06.2019 19:10, bleesedbeme
What is the total surface area of this square pyramid?
Answers: 2
You know the right answer?
The table shows the population P (in millions) of the United States from 1800 to 1870 where t repres...
Questions in other subjects:

Biology, 05.02.2021 18:00

Chemistry, 05.02.2021 18:00
Chemistry, 05.02.2021 18:00
Mathematics, 05.02.2021 18:00
Mathematics, 05.02.2021 18:00
Mathematics, 05.02.2021 18:00


