
Mathematics, 20.02.2020 23:40 mariam00000w
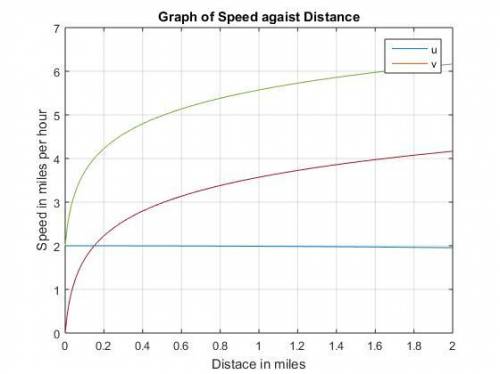
Use MATLAB to plot the functions u = 2 log10 (60x + 1) and v = 3 cos(6x) over the interval 0 ≤ x ≤ 2. Properly label the plot and each curve. The variables u and v represent speed in miles per hour; the variable x represents distance in miles.

Answers: 3


Other questions on the subject: Mathematics
Mathematics, 20.06.2019 18:04, mazolethrin5672
What is the difference between the number of adult dogs at the park on monday and tuesday
Answers: 1
Mathematics, 21.06.2019 14:30, Pumpkinputters
What is the inverse of the function f(x)=4x+8
Answers: 1
Mathematics, 21.06.2019 20:20, kenken2583
Complete the input-output table for the linear function y = 3x. complete the input-output table for the linear function y = 3x. a = b = c =
Answers: 2
You know the right answer?
Use MATLAB to plot the functions u = 2 log10 (60x + 1) and v = 3 cos(6x) over the interval 0 ≤ x ≤ 2...
Questions in other subjects:

Mathematics, 03.09.2019 02:20

Biology, 03.09.2019 02:20

History, 03.09.2019 02:20


