
Mathematics, 20.02.2020 22:51 ozzy1146
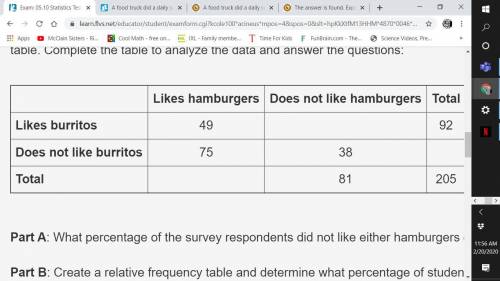
A food truck did a daily survey of customers to find their food preferences. The data is partially entered in the frequency table. Complete the table to analyze the data and answer the questions:
the graph is the picture
Part A: What percentage of the survey respondents did not like either hamburgers or burritos? (2 points)
Part B: Create a relative frequency table and determine what percentage of students who like hamburgers also like burritos. (3 points)
Part C: Use the conditional relative frequencies to determine which two data point has strongest association of its two factors. Use complete sentences to explain your answer. (5 points)

Answers: 2


Other questions on the subject: Mathematics
Mathematics, 21.06.2019 15:00, babygirl123468
Martha needs 22.25 strawberries for every 5 smoothies she makes. complete the table to see how many strawberries she would need to make 10 smoothies and 20 smoothies.
Answers: 1
Mathematics, 21.06.2019 22:30, cramirezorozco392
Whit h equation best represents this situation the number 98 increased by an unknown number equal to 120
Answers: 1
You know the right answer?
A food truck did a daily survey of customers to find their food preferences. The data is partially e...
Questions in other subjects:

Biology, 27.01.2021 23:50

Mathematics, 27.01.2021 23:50
Mathematics, 27.01.2021 23:50
History, 27.01.2021 23:50


