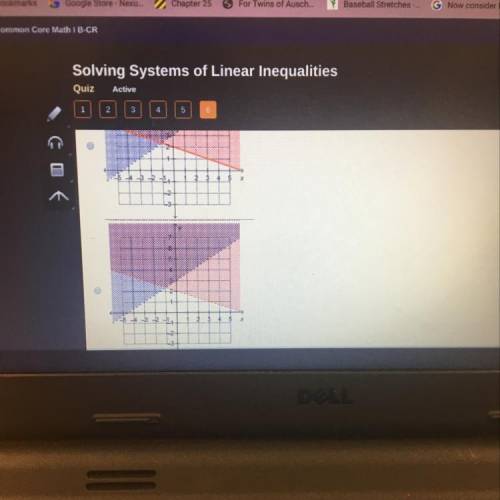
Which graph shows the solution to the system of linear inequalities?
y> 2 x + 3
ys-1/...

Mathematics, 20.02.2020 21:56 lcoronilla96
Which graph shows the solution to the system of linear inequalities?
y> 2 x + 3
ys-1/3x + 2

Answers: 1


Other questions on the subject: Mathematics
Mathematics, 21.06.2019 17:10, ohartshorn3670
Consider the functions below. function 1 function 2 function 3 select the statement which is true about the functions over the interval [1, 2] a b function 3 has the highest average rate of change function 2 and function 3 have the same average rate of change. function and function 3 have the same average rate of change function 2 has the lowest average rate of change d.
Answers: 3
Mathematics, 22.06.2019 00:40, Hjackson24
What is the interquartile range (iqr) of the data set represented by this box plot?
Answers: 3
Mathematics, 22.06.2019 01:00, jazzytazzyyy
Use mathematical induction to prove the statement is true for all positive integers n, or show why it is false. 1^2 + 4^2 + 7^2 + + (3n - 2)^2 = [n(6n^2-3n-1)/2]
Answers: 1
Mathematics, 22.06.2019 03:00, jdkrisdaimcc11
Gabrielle's age is three times mikhail's age. the sum of their ages is 40 . what is mikhail's age? __ years old
Answers: 2
You know the right answer?
Questions in other subjects:

Biology, 16.12.2020 22:40


Geography, 16.12.2020 22:40


