
Mathematics, 20.02.2020 17:20 globalremix
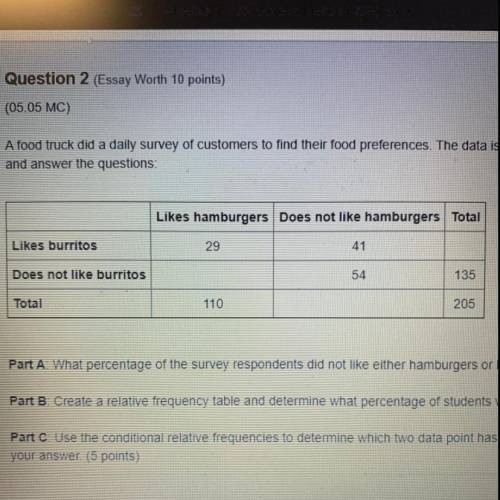
A food truck did a daily survey of customers to find their food preferences. The data is partially entered in the frequency table. Complete the table to analyze the data
and answer the questions:
Likes hamburgers Does not like hamburgers Total
Likes burritos 29
41
Does not like burritos
54 135
Total
110
205
Part A What percentage of the survey respondents did not like either hamburgers or burritos? (2 points)
Part B. Create a relative frequency table and determine what percentage of students who like hamburgers also like burritos (3 points)
Part Use the conditional relative frequencies to determine which two data point has strongest association of its two factors. Use complete sentences to explain
your answer. (5 points)

Answers: 2


Other questions on the subject: Mathematics
Mathematics, 21.06.2019 23:00, darrell1168
How many 2/5s are in 1 and 1/2 plz someone me right now
Answers: 1
Mathematics, 22.06.2019 01:20, corbeansbrain
Can you me with this question? i'll reward *30 points i just need with this one question so that i could solve the others. * edit: i originally set up the question to reward 30 points, but for some reason i can only reward 15. if you don't get 30, then i'm sorry. i'm still kind of new to this site
Answers: 1
You know the right answer?
A food truck did a daily survey of customers to find their food preferences. The data is partially e...
Questions in other subjects:
Mathematics, 22.08.2019 04:30


Physics, 22.08.2019 04:30

Biology, 22.08.2019 04:30

History, 22.08.2019 04:30
Mathematics, 22.08.2019 04:30


