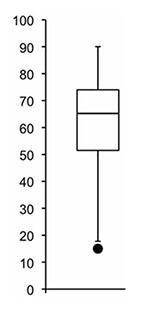
Which of the following is true of the data represented by the box plot?
a If the outlier is in...

Mathematics, 20.02.2020 08:47 kayeeii
Which of the following is true of the data represented by the box plot?
a If the outlier is included in the data, the median would not significantly change.
b If the outlier is included in the data, the mean would increase.
c If the outlier is included in the data, the box plot would be significantly skewed.
d If the outlier is included in the data, the length of the tails would change significantly.

Answers: 1


Other questions on the subject: Mathematics
Mathematics, 21.06.2019 15:00, vnzgirl
1. there are 25 students who started computer programming in elementary school and 25 students who started computer programming in middle school. the first group had a mean final project grade of 95% and the second group had a mean final project grade of 92%. the line plot shows the differences after 10 rerandomizations. determine whether the difference in the means of the two groups is significant based on the line plot. explain your answer.
Answers: 1
Mathematics, 21.06.2019 18:30, Karinaccccc
Astick 2 m long is placed vertically at point b. the top of the stick is in line with the top of a tree as seen from point a, which is 3 m from the stick and 30 m from the tree. how tall is the tree?
Answers: 2
Mathematics, 21.06.2019 19:00, vince022503
At $1.32 million, they closed last month percent above what they paid in 2007." how much did they pay in 2007?
Answers: 1
You know the right answer?
Questions in other subjects:


Computers and Technology, 20.07.2019 03:20
Computers and Technology, 20.07.2019 03:20


