
Mathematics, 20.02.2020 02:01 sis212
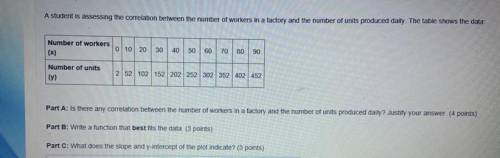
A student is assessing the correlation between the number of workers in a factory and the number of units produced daily. The table shows the data:
GRAPH IS LOCATED IN PICTURES!
Part A: Is there any correlation between the number of workers in a factory and the number of units produced daily? Justify your answer. (4 points)
Part B: Write a function that best fits the data. (3 points)
Part C: What does the slope and y-intercept of the plot indicate? (3 points)

Answers: 2


Other questions on the subject: Mathematics
Mathematics, 21.06.2019 15:30, adriana145
With these: 18/36 = 1/? missing number change 1 5/8 to improper fraction. change 19/5 to a mixed number.
Answers: 3
Mathematics, 21.06.2019 20:00, serianmollel
Which statement about the annual percentage rate (apr) is not true?
Answers: 3
Mathematics, 21.06.2019 20:30, Travisbennington
Three numbers x, y, and z are in the ratio 2: 7: 8. if 12 is subtracted from y, then three numbers form a geometric sequence (in the order x, y–12, z). find x, y, and z. there are 2 sets.
Answers: 1
You know the right answer?
A student is assessing the correlation between the number of workers in a factory and the number of...
Questions in other subjects:

Mathematics, 23.05.2021 17:50

History, 23.05.2021 17:50
History, 23.05.2021 17:50
Mathematics, 23.05.2021 17:50
History, 23.05.2021 17:50
Mathematics, 23.05.2021 17:50


