Mathematics, 19.02.2020 21:09 Arellano4672
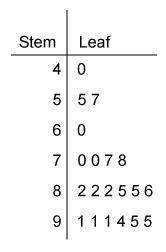
The scatter plot shows the number of strawbernes that have been picked on the farm during the month of February.
Part A Using computer software, a correlation coefficient of 0.01 was calculated Based on the scatter plot, is that an accurate value for this data? Why or why not? (5 points)
Part B. Instead of comparing the number of strawberries picked and the day in February, write a scenario that would be a causal relationship for strawberries picked on the farm (5 points)

Answers: 1


Other questions on the subject: Mathematics

Mathematics, 20.06.2019 18:04, holamigosss
Which problem could be solved by evaluating the expression 7×(−3)7×-3?
Answers: 3

Mathematics, 21.06.2019 16:30, nicoleskertich
The difference between tax advoidance and tax evasion
Answers: 1

Mathematics, 21.06.2019 17:00, gomez36495983
() at a farm, animals are fed bales of hay and buckets of gain. each bale of hay is in the shape of a rectangular prism. the base side lengths 2 feet and 3 feet, and the height is 5 feet. each bucket of grain is a cylinder with diameter of 3 feet. the height of the bucket is 5 feet as the height of bale. a. which is larger in area, the rectangular base of the bale or the circular base of the bucket? explain how you know b. which is larger in volume, the bale or the bucket? explain how you know
Answers: 1

Mathematics, 21.06.2019 20:00, sadsociety41
Afamily has five members. a mom, a dad, two sisters, & a brother. the family lines up single file. what is the probabillity that the mom is at the front of the line
Answers: 1
You know the right answer?
The scatter plot shows the number of strawbernes that have been picked on the farm during the month...
Questions in other subjects:

Computers and Technology, 02.10.2020 14:01


English, 02.10.2020 14:01


Physics, 02.10.2020 14:01


Mathematics, 02.10.2020 14:01

English, 02.10.2020 14:01


