The following dot plot represents Set A.
How many data points are in Set A?
Calcul...

Mathematics, 19.02.2020 01:52 naomifelixwoo
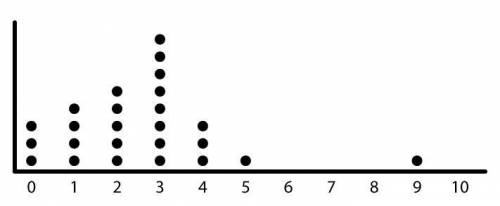
The following dot plot represents Set A.
How many data points are in Set A?
Calculate the median and mode for this set of data.
Calculate the range and interquartile range for this set of data.
Visually analyze the data, using the terms cluster, gap, and outlier in your analysis. Write your answer in two or more complete sentences.

Answers: 3


Other questions on the subject: Mathematics
Mathematics, 21.06.2019 21:00, cicimarie2018
Choose the equation that represents the graph below: (1 point) graph of a line passing through points negative 3 comma 0 and 0 comma 3 y = x − 3 y = −x + 3 y = −x − 3 y = x + 3 will award !
Answers: 3
You know the right answer?
Questions in other subjects:

History, 08.05.2022 07:30
History, 08.05.2022 08:10

Chemistry, 08.05.2022 08:30

Mathematics, 08.05.2022 08:40


