


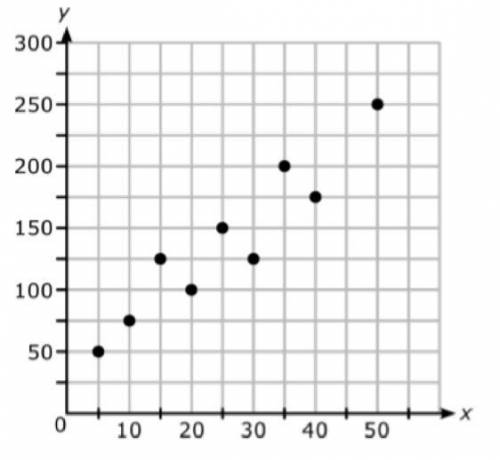
Which equation BEST models the data shown in the scatterplot below?
A. y=3x+10
B. y=3x+6...

Mathematics, 18.02.2020 22:36 sydc1215
Which equation BEST models the data shown in the scatterplot below?
A. y=3x+10
B. y=3x+60
C. y=4x+5
D. y=4x+35

Answers: 2


Other questions on the subject: Mathematics
Mathematics, 21.06.2019 21:30, neptunesx
Students are given 3 minutes to complete each multiple-choice question on a test and 8 minutes for each free-responsequestion. there are 15 questions on the test and the students have been given 55 minutes to complete itwhich value could replace x in the table? 5507-m23-m8(15-m)8(15)-m
Answers: 2
Mathematics, 22.06.2019 00:00, egirl7838
Titus works at a hotel. part of his job is to keep the complimentary pitcher of water at least half full and always with ice. when he starts his shift, the water level shows 4 gallons, or 128 cups of water. as the shift progresses, he records the level of the water every 10 minutes. after 2 hours, he uses a regression calculator to compute an equation for the decrease in water. his equation is w –0.414t + 129.549, where t is the number of minutes and w is the level of water. according to the equation, after about how many minutes would the water level be less than or equal to 64 cups?
Answers: 2
You know the right answer?
Questions in other subjects:


Mathematics, 18.02.2020 20:54
Engineering, 18.02.2020 20:54


