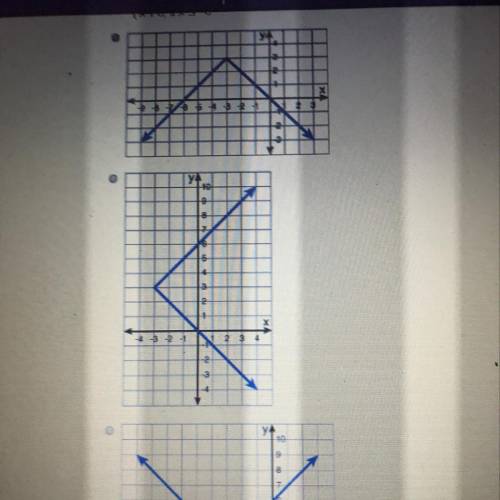
Which graph represents the function below?
s-x if x>-3
y = x+6, if xs-3
...

Mathematics, 18.02.2020 20:57 terribrady98
Which graph represents the function below?
s-x if x>-3
y = x+6, if xs-3

Answers: 1


Other questions on the subject: Mathematics
Mathematics, 21.06.2019 15:30, mattstudy305
The appalachian trail is a hiking trail that passes through the appalachian mountains. three members of a teen hiking group hiked a section of the trail. the hikers stopped at a rest area and equally shared 3 4 gallon of water. how much water did each person get?
Answers: 1
Mathematics, 21.06.2019 16:10, dhernandez081
To find the extreme values of a function f(x. y) on a curve x-x(t), y y(t), treat f as a function of the single variable t and use the chain rule to find where df/dt is zero. in any other single-variable case, the extreme values of f are then found among the values at the critical points (points where df/dt is zero or fails to exist), and endpoints of the parameter domain. find the absolute maximum and minimum values of the following function on the given curves. use the parametric equations x=2cos t, y 2 sin t functions: curves: i) the semicircle x4,y20 i) the quarter circle x2+y-4, x20, y20 b, g(x, y)=xy
Answers: 2
Mathematics, 21.06.2019 16:20, TheVariableWhoLived
Ivan began dividing g2 – 6 by g + 1, noting that . he started by placing g in the quotient, as shown below. what is g2 – 6 divided by g + 1? g – 1 – g + 1 – g – 7 + g – 5 +
Answers: 3
You know the right answer?
Questions in other subjects:

Business, 14.11.2020 06:30


Health, 14.11.2020 06:30
Mathematics, 14.11.2020 06:30

Social Studies, 14.11.2020 06:30
Medicine, 14.11.2020 06:30


