
Mathematics, 18.02.2020 08:12 jaylaa04
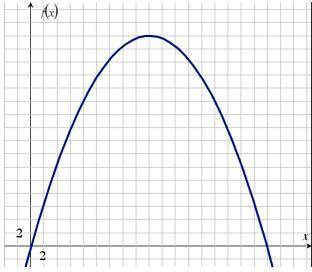
The graph below shows the height of a tunnel f(x), in feet, depending on the distance from one side of the tunnel x, in feet:
Graph of quadratic function f of x having x-intercepts at ordered pairs 0, 0 and 36, 0. The vertex is at 18, 32.
Part A: What do the x-intercepts and maximum value of the graph represent? What are the intervals where the function is increasing and decreasing, and what do they represent about the distance and height? (6 points)
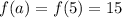
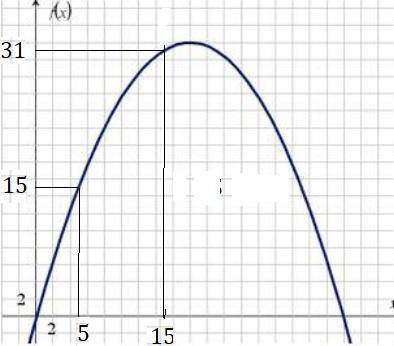
Part B: What is an approximate average rate of change of the graph from x = 5 to x = 15, and what does this rate represent? (4 points)

Answers: 2


 ----> see the attached figure
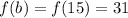 ----> see the attached figure


Other questions on the subject: Mathematics
Mathematics, 21.06.2019 18:30, sakria2002
What can each term of the equation be multiplied by to eliminate the fractions before solving? x – + 2x = + x 2 6 10 12
Answers: 1
Mathematics, 21.06.2019 19:10, lays20001
Which situation can be modeled by the inequality 5 + 10w ≥ 45? a. you start with $5 and save $10 a week until you have at least $45. b. you start with 5 baseball cards and purchase 10 cards every week until you have at most 45 cards. c. you start with 5 water bottles and purchases cases of 10 water bottles each until you have a total of 45 water bottles. d. you spend $5 plus $10 per week until you have less than $45.
Answers: 3
You know the right answer?
The graph below shows the height of a tunnel f(x), in feet, depending on the distance from one side...
Questions in other subjects:

Physics, 13.11.2020 18:30


History, 13.11.2020 18:30

Spanish, 13.11.2020 18:30

Mathematics, 13.11.2020 18:30
History, 13.11.2020 18:30


