
Mathematics, 18.02.2020 05:40 yunggod146
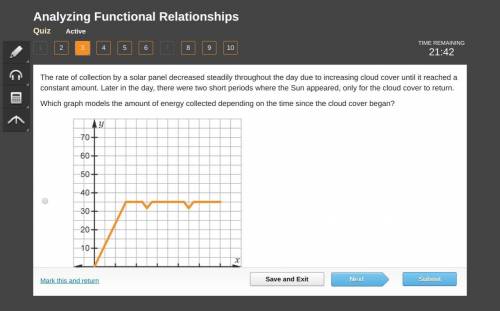
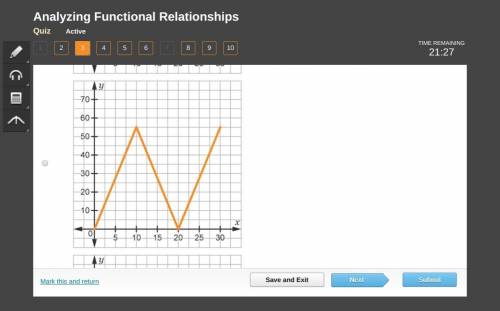
The rate of collection by a solar panel decreased steadily throughout the day due to increasing cloud cover until it reached a constant amount. Later in the day, there were two short periods where the Sun appeared, only for the cloud cover to return.
Which graph models the amount of energy collected depending on the time since the cloud cover began?
(Graphs are in order from A B C D)


Answers: 3


Other questions on the subject: Mathematics
Mathematics, 21.06.2019 15:00, BeautyxQueen
Find three consecutive numbers such that the sum of one-fourth the first and one-fifth the second is five less than one-seventh the third
Answers: 1
Mathematics, 21.06.2019 15:10, blessing5266
Aline on the wall and a line on the floor are skew. always, sometimes, or never?
Answers: 3
Mathematics, 21.06.2019 15:20, kylabreanne120
(a) (8%) compute the probability of an even integer among the 100 integers 1! , 2! , 3! , until 100! (here n! is n factorial or n*(n-1)*(n-2) *… 1) (b) (16%) compute the probability of an even integer among the 100 integers: 1, 1+2, 1+2+3, 1+2+3+4, …., 1+2+3+… + 99, and 1+2+3+… + 100
Answers: 1
Mathematics, 21.06.2019 17:00, ChooseHappy
One side of a rectangle is 7 feet shorter than seven times the other side. find the length of the shorter side if we also know that the perimeter of the rectangle is 306 feet.
Answers: 2
You know the right answer?
The rate of collection by a solar panel decreased steadily throughout the day due to increasing clou...
Questions in other subjects:

Medicine, 27.01.2021 08:50

English, 27.01.2021 08:50
Health, 27.01.2021 08:50
Mathematics, 27.01.2021 08:50

Social Studies, 27.01.2021 08:50

Biology, 27.01.2021 08:50
Mathematics, 27.01.2021 08:50

Physics, 27.01.2021 08:50


