
Mathematics, 17.02.2020 22:20 saja19
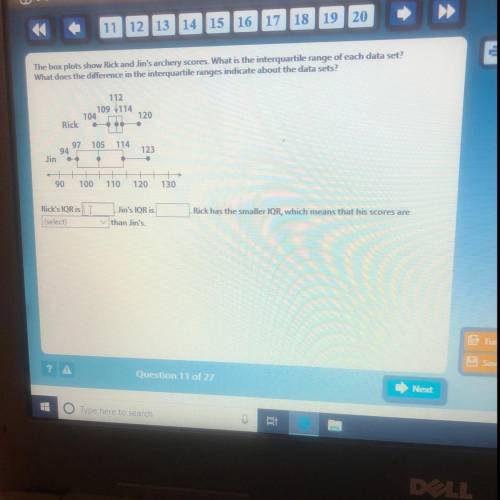
The box plots show Rick and Jin's archery scores. What is the interquartile range of each data set?
What does the difference in the interquartile ranges indicate about the data sets?
112
- 109 114
104
120
120
Ricka
97
105
114
123
]
Jin
90
100
110
120
130
Rick's IQR is
(select)
Jin's IQR is
than Jin's
Rick has the smaller IQR, which means that his scores are

Answers: 1


Other questions on the subject: Mathematics
Mathematics, 21.06.2019 18:30, josephmartinelli5
What is the prime factorization of 23 ?me with this question
Answers: 1
Mathematics, 22.06.2019 00:50, ladnerhailey16
Assume that adults have iq scores that are normally distributed with a mean of mu equals 100 and a standard deviation sigma equals 20. find the probability that a randomly selected adult has an iq between 80 and 120.assume that adults have iq scores that are normally distributed with a mean of mu equals 100 and a standard deviation sigma equals 20. find the probability that a randomly selected adult has an iq between 80 and 120.
Answers: 3
Mathematics, 22.06.2019 03:00, tatilynnsoto17
I’m how many different ways can she give the four remaining flowers to the rest of the teachers in the afternoon
Answers: 2
You know the right answer?
The box plots show Rick and Jin's archery scores. What is the interquartile range of each data set?<...
Questions in other subjects:


Biology, 06.03.2020 22:36


