
Mathematics, 15.02.2020 03:43 mgreenamb
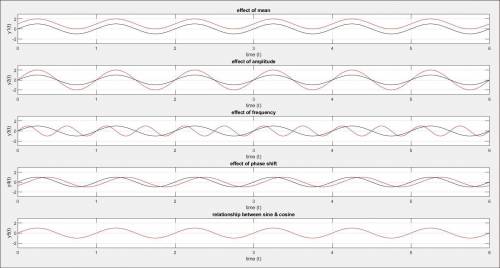
Develop a MATLAB script to generate a 5 panel vertical plot to illustrate how a function changes as the parameters change. On each plot, display the simple sine wave, y(t) = sin(2πt), as a red line. Then, add the following functions to each of the 5-panels as black lines:

Answers: 1


Other questions on the subject: Mathematics
Mathematics, 21.06.2019 14:50, gonzalesnik
Write the linear inequality shown in the graph. the gray area represents the shaded region. y> -3y+5 y> 3x-5 y< -3x+5 y< 3x-5
Answers: 1
Mathematics, 21.06.2019 17:30, zylovesnesha
If jaime wants to find 60% of 320, which table should he use?
Answers: 1
Mathematics, 21.06.2019 18:00, jenniferkane408
Look at arnold's attempt to solve the equation for b: 3b = 12 b = 3 · 12 b = 36 describe the mistake that arnold made.
Answers: 2
Mathematics, 21.06.2019 19:30, tyeni2crazylolp7a3hk
If chord ab is congruent to chord cd, then what must be true about ef and eg?
Answers: 1
You know the right answer?
Develop a MATLAB script to generate a 5 panel vertical plot to illustrate how a function changes as...
Questions in other subjects:
Mathematics, 04.11.2020 16:50
Mathematics, 04.11.2020 16:50

Mathematics, 04.11.2020 16:50


Mathematics, 04.11.2020 16:50

Arts, 04.11.2020 16:50

English, 04.11.2020 16:50


