
Mathematics, 15.02.2020 01:57 Anabel818
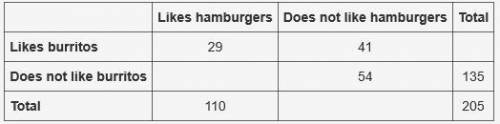
A food truck did a daily survey of customers to find their food preferences. The data is partially entered in the frequency table. Complete the table to analyze the data and answer the questions: Likes hamburgers Does not like hamburgers Total Likes burritos 29 41 Does not like burritos 54 135 Total 110 205 Part A: What percentage of the survey respondents did not like either hamburgers or burritos? (2 points) Part B: Create a relative frequency table and determine what percentage of students who like hamburgers also like burritos. (3 points) Part C: Use the conditional relative frequencies to determine which two data point has strongest association of its two factors. Use complete sentences to explain your answer. (5 points)
P. S Answer quickly! I know A and B so please just answer C for me please!!!

Answers: 3


Other questions on the subject: Mathematics
Mathematics, 21.06.2019 22:30, winterblanco
How do you do the foil method with polynomials?
Answers: 1
Mathematics, 22.06.2019 00:30, mercydiaz84
Measure a and b and find their sum. how are the angles related?
Answers: 3
You know the right answer?
A food truck did a daily survey of customers to find their food preferences. The data is partially e...
Questions in other subjects:

History, 15.10.2020 02:01
Mathematics, 15.10.2020 02:01


Mathematics, 15.10.2020 02:01
Mathematics, 15.10.2020 02:01
Mathematics, 15.10.2020 02:01
History, 15.10.2020 02:01


