
Mathematics, 14.02.2020 21:39 star3554
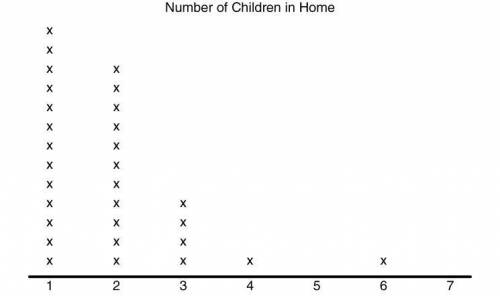
The following dot plot represents a random sample of elementary students and the number of children that live in their home.
If this random sample is representative of elementary students in the United States, which of the following inferences can be made from the data? Select all that apply.
All households in the United States contain at least one child.
Very few households in the United States contain four or more children.
None of the households in the United States contain five children.
The majority of the households in the United States, with at least one child, contain less than three children.

Answers: 3


Other questions on the subject: Mathematics
Mathematics, 21.06.2019 16:00, kell22wolf
Part one: measurements 1. measure your own height and arm span (from finger-tip to finger-tip) in inches. you will likely need some from a parent, guardian, or sibling to get accurate measurements. record your measurements on the "data record" document. use the "data record" to you complete part two of this project. name relationship to student x height in inches y arm span in inches archie dad 72 72 ginelle mom 65 66 sarah sister 64 65 meleah sister 66 3/4 67 rachel sister 53 1/2 53 emily auntie 66 1/2 66 hannah myself 66 1/2 69 part two: representation of data with plots 1. using graphing software of your choice, create a scatter plot of your data. predict the line of best fit, and sketch it on your graph. part three: the line of best fit include your scatter plot and the answers to the following questions in your word processing document 1. 1. which variable did you plot on the x-axis, and which variable did you plot on the y-axis? explain why you assigned the variables in that way. 2. write the equation of the line of best fit using the slope-intercept formula $y = mx + b$. show all your work, including the points used to determine the slope and how the equation was determined. 3. what does the slope of the line represent within the context of your graph? what does the y-intercept represent? 5. use the line of best fit to you to describe the data correlation.
Answers: 2
Mathematics, 21.06.2019 20:00, brevenb375
What effect would doubling all the dimensions of a triangular pyramid have on the volume of the pyramid? explain your reasoning.
Answers: 1
Mathematics, 22.06.2019 01:50, vorhees2406
If jklm is a trapezoid, which statements must be true?
Answers: 1
You know the right answer?
The following dot plot represents a random sample of elementary students and the number of children...
Questions in other subjects:


World Languages, 05.08.2021 17:40
English, 05.08.2021 17:40


Geography, 05.08.2021 17:40
Mathematics, 05.08.2021 17:40
English, 05.08.2021 17:40


