
Mathematics, 14.02.2020 06:49 camilacarrielh15
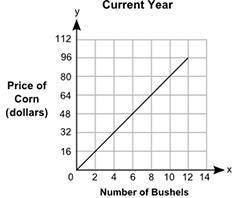
A graph was made to show the yield and prices of a farm crop for the current year. A table was made to show the yield and prices from the year before.
Number of Bushels Price of corn (Dollars)
2 12
4 24
6 36
8 48
Explain how you can determine the rate of change for the current year.
Compare the price of a bushel from the current year to the year before...how much more is the price for a bushel in the current year? Show your work used to find both prices and the difference.

Answers: 1


Other questions on the subject: Mathematics
Mathematics, 22.06.2019 01:40, tinamarie04ts
Agroup of student volunteers participates in a study designed to assess several behavioral interventions for improving output in a repetitive task. prior to the beginning of the study, all volunteers unknowingly observed, and their output is measured. at the beginning of the study, prior to any intervention, the volunteers perform the same task under the observation of a study administrator, and their overall output increases. which of the following terms describes this phenomenon? a. simpson's paradox b. hawthorne effect are d. novelty effect d. pygmalion effect e. observer-expectancy effect
Answers: 1
You know the right answer?
A graph was made to show the yield and prices of a farm crop for the current year. A table was made...
Questions in other subjects:
Mathematics, 25.09.2019 23:30


Advanced Placement (AP), 25.09.2019 23:30

Health, 25.09.2019 23:30
Mathematics, 25.09.2019 23:30

Social Studies, 25.09.2019 23:30


