
Mathematics, 14.02.2020 04:13 echavarrianoah
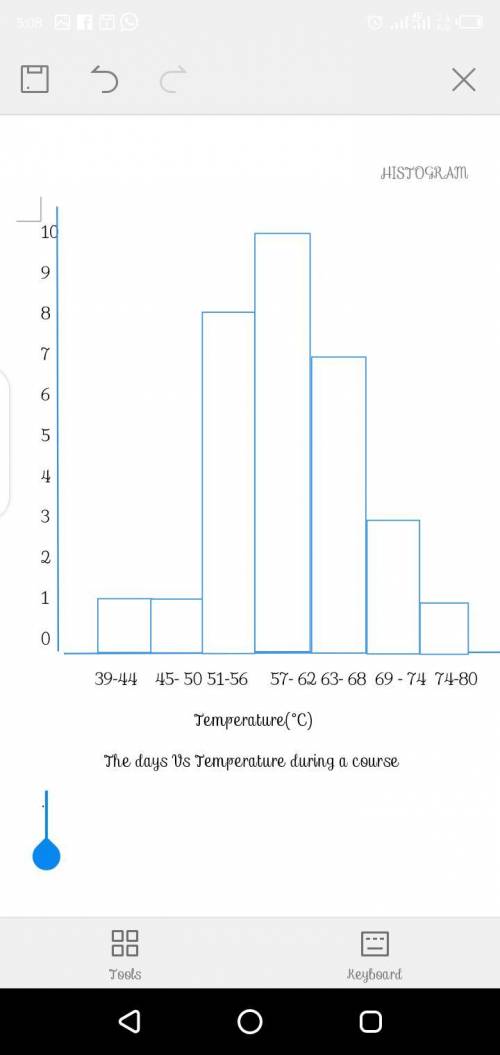
The frequency distribution below represents frequencies of actual low temperatures recorded during the course of a 31-day month. Use the frequency distribution to construct a histogram. Do the data appear to have a distribution that is approximately normal?
Class Frequency
A 39 minus 44 1
B 45 minus 50 1
C 51 minus 56 8
D 57 minus 62 10
E 63 minus 68 7
F 69 minus 74 3
G 75 minus 80 1

Answers: 3


Other questions on the subject: Mathematics
Mathematics, 21.06.2019 19:20, hahah265
Suppose that a households monthly water bill (in dollars) is a linear function of the amount of water the household uses (in hundreds of cubic feet, hcf). when graphed, the function gives a line with slope of 1.65. if the monthly cost for 13 hcf is $46.10 what is the monthly cost for 19 hcf?
Answers: 3
Mathematics, 21.06.2019 20:50, karaisabelhill
Find the missing variable for a parallelogram: a = latex: 32in^2 32 i n 2 h = b = 6.3 in (1in=2.54cm)
Answers: 2
You know the right answer?
The frequency distribution below represents frequencies of actual low temperatures recorded during t...
Questions in other subjects:
Mathematics, 15.11.2019 21:31

History, 15.11.2019 21:31

Mathematics, 15.11.2019 21:31

Mathematics, 15.11.2019 21:31
Mathematics, 15.11.2019 21:31

World Languages, 15.11.2019 21:31
Mathematics, 15.11.2019 21:31


