
Mathematics, 14.02.2020 03:21 05eviebee
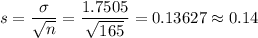
Assume a recent sociological report states that university students drink 4.10 alcoholic drinks per week on average, with a standard deviation of 1.7505. Suppose Jason, a policy manager at a local university, decides to take a random sample of 165 university students to survey them about their drinking habits. Determine the mean and standard deviation of the sampling distribution of the sample mean alcohol consumption. Provide your answer with precision to two decimal places.

Answers: 2


Other questions on the subject: Mathematics
Mathematics, 21.06.2019 17:40, samvgesite
Divide. reduce the answer to lowest terms.5 2/3 ÷ 3 1/9
Answers: 3
Mathematics, 22.06.2019 00:50, issacurlyheadka
Solve the problem by using a venn diagram a group of students were surveyed about their taste in music. they were asked how they like three types of music: rock, country western and jazz. the results are summarized below: no one dislikes all three types of music. six like all three types of music. eleven don’t like country western. sixteen like jazz. three like country western and jazz, but not rock. six don’t like rock. eight like rock and country western. seven don’t like jazz. how many students were surveyed?
Answers: 3
Mathematics, 22.06.2019 03:30, narnar5664
Nina has prepared the following two-column proof below. she is given that ∠oln ≅ ∠lno and she is trying to prove that ol ≅ on. triangle oln, where angle oln is congruent to angle lno step statement reason 1 ∠oln ≅ ∠lno given 2 draw oe as a perpendicular bisector to ln by construction 3 ∠leo ≅ ∠neo transitive property of equality 4 m∠leo = 90° definition of a perpendicular bisector 5 m∠neo = 90° definition of a perpendicular bisector 6 le ≅ en definition of a perpendicular bisector 7 δole ≅ δone side-angle-side (sas) postulate 8 ol ≅ on cpctc nina made two errors in the proof. identify and correct the errors.
Answers: 3
Mathematics, 22.06.2019 04:30, Geo777
Determine whether the data described are qualitative or quantitative and give their level of measurement if the data are quantitative, state whether they are continuous or discrete. soft drink sizes: small, medium, large. oa. qualitative, nominal o b. qualitative, ordinal- o c. quantitative, ordinal, discrete o d. quantitative, ordinal
Answers: 3
You know the right answer?
Assume a recent sociological report states that university students drink 4.10 alcoholic drinks per...
Questions in other subjects:


Spanish, 02.02.2020 22:43

Social Studies, 02.02.2020 22:44
Mathematics, 02.02.2020 22:44


Computers and Technology, 02.02.2020 22:44

Mathematics, 02.02.2020 22:44


