
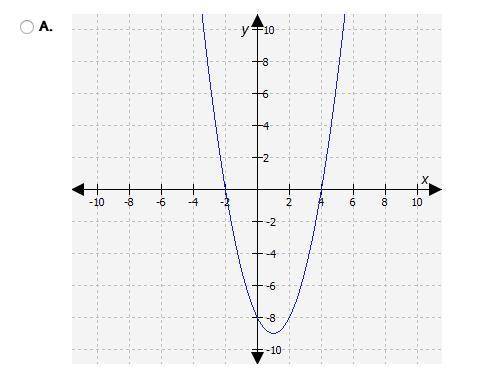
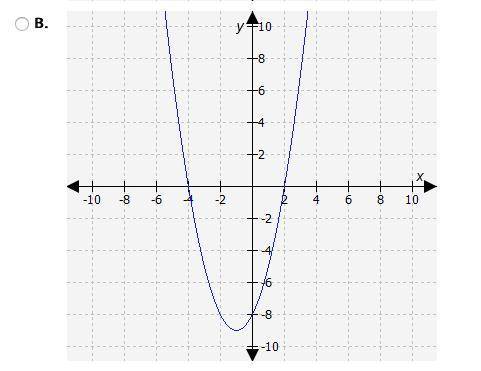
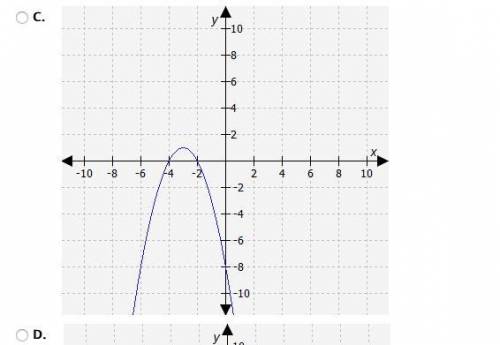
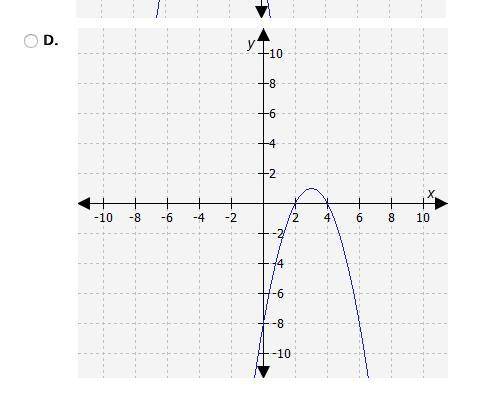
If the zeros of a quadratic functions are -2 and 4, which graph could represent the function?
<...

Mathematics, 12.02.2020 19:58 nails4life324
If the zeros of a quadratic functions are -2 and 4, which graph could represent the function?

Answers: 1


Other questions on the subject: Mathematics
Mathematics, 21.06.2019 14:30, gujaratif932
Compare these two waves: the blue and orange waves have the same pitch, but the blue wave is louder. the blue and orange waves have the same volume, but the blue wave has a higher pitch. the orange wave has a higher pitch, but the blue wave is louder. the blue wave has a higher pitch, but the orange wave is louder.
Answers: 1
Mathematics, 21.06.2019 20:30, Gabyngreen
What is the interquartile range of this data set? 2, 5, 9, 11, 18, 30, 42, 48, 55, 73, 81
Answers: 1
Mathematics, 21.06.2019 21:20, madisontrosclair2
Amajor grocery store chain is trying to cut down on waste. currently, they get peaches from two different distributors, whole fruits and green grocer. out of a two large shipments, the manager randomly selects items from both suppliers and counts the number of items that are not sell-able due to bruising, disease or other problems. she then makes a confidence interval. is there a significant difference in the quality of the peaches between the two distributors? 95% ci for pw-pg: (0.064, 0.156)
Answers: 3
You know the right answer?
Questions in other subjects:

Business, 17.06.2020 19:57
Mathematics, 17.06.2020 19:57

History, 17.06.2020 19:57


