
Mathematics, 12.02.2020 05:56 zemathes
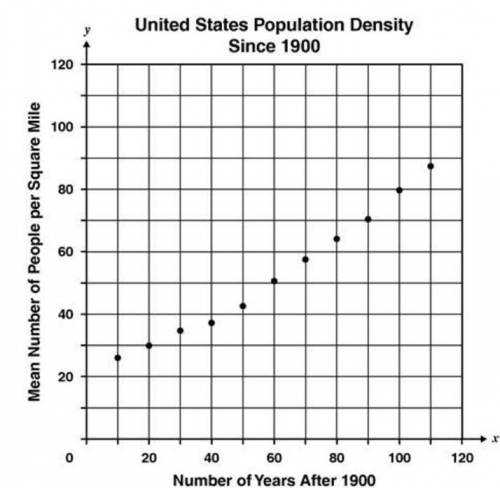
This scatterplot shows the mean number of people per square mile in the US during every tenth year since 1900.
Based on the data, which value is the BEST prediction for the mean number of people per square mile in the US in the year 2100?
A. 108
B. 124
C.134
D.140

Answers: 2


Other questions on the subject: Mathematics
Mathematics, 21.06.2019 18:00, cici170
Each month, a shopkeeper spends 5x + 14 dollars on rent and electricity. if he spends 3x−5 dollars on rent, how much does he spend on electricity? for which value(s) of x is the amount the shopkeeper spends on electricity less than $100? explain how you found the value(s).
Answers: 2
Mathematics, 21.06.2019 23:30, Masielovebug
Segment wx is shown explain how you would construct a perpendicular bisector of wx using a compass and a straightedge
Answers: 3
Mathematics, 22.06.2019 03:00, webbhlharryteach
Out of five men and five women, we form a committee consisting of four different people. assuming that each committee of size four is equally likely, find the probabilities of the following events: 1. the committee consists of two men and two women 2. the committee has more women than men. 3. the committee has at least one man. for the remainder of the problem assume that alice and bob are among the ten people being considered. 4. both alice and bob are members of the committee.
Answers: 2
You know the right answer?
This scatterplot shows the mean number of people per square mile in the US during every tenth year s...
Questions in other subjects:
Mathematics, 19.03.2020 22:13

Mathematics, 19.03.2020 22:13

History, 19.03.2020 22:13
Mathematics, 19.03.2020 22:13


English, 19.03.2020 22:14


