
Mathematics, 12.02.2020 01:57 chrjergre6520
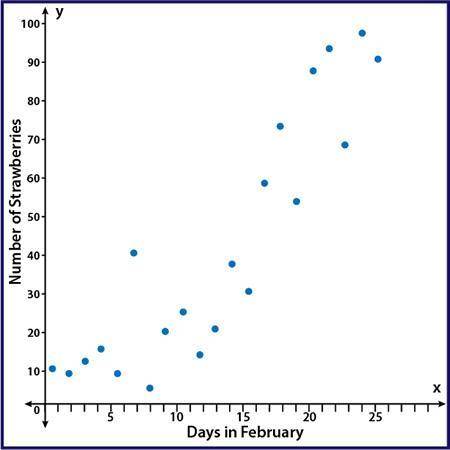
The scatter plot shows the number of strawberries that have been picked on the farm during the month of February:
A scatter plot with points showing an upward trend with points that are moderately spread out from a line of best fit. The y-axis is labeled Number of Strawberries and the x axis is labeled Days in February
Part A: Using computer software, a correlation coefficient of r = 0.01 was calculated. Based on the scatter plot, is that an accurate value for this data? Why or why not? (5 points)
Part B: Instead of comparing the number of strawberries picked and the day in February write a scenario that would be a causal relationship for strawberries picked on the farm. (5 points)

Answers: 3


Other questions on the subject: Mathematics
Mathematics, 21.06.2019 15:00, jazz589729
12 point are triangles pqr and stu congruent? what is the congruency that proves they are congruent? what is the perimeter of triangle pqr?
Answers: 2
Mathematics, 22.06.2019 01:30, zariah10191101
What is the remainder when 3x^2-x-10 is divided by x-1 -6,-7,-8, or -9
Answers: 1
Mathematics, 22.06.2019 04:30, ashton3952525
The survey of study habits and attitudes (ssha) is a psychological test that measures the motivation, attitude toward school, and study habits of students, scores range from 0 to 200. the mean score for u. s. college students is about 115, and the standard deviation is about 30. a teacher who suspects that older students have better attitudes toward school gives the ssha to 55 students who are at least 30 years of age. the mean score is 113.2. assume the population standard deviation is 30 for older students what is the margin of error for a 95% confidence interval for the population mean score for a. older students? b. compute the 95% confidence interval for the population mean score for older students. c. compute the 99% confidence interval for the population mean score for older students. d. compute the 88% confidence interval for the population mean score for older students.
Answers: 3
Mathematics, 22.06.2019 09:40, tori829
Suppose there are collectively 277 finance and management majors (combined). of those, 85 males are finance majors, 65 females are finance majors, 52 males are management majors, and the remaining are female management majors. when testing (at the 5% level of significance) whether the gender and major are independent, what is the test statistic ? ( round your answer to 3 decimal places)
Answers: 3
You know the right answer?
The scatter plot shows the number of strawberries that have been picked on the farm during the month...
Questions in other subjects:


