
Mathematics, 12.02.2020 00:00 Kenzijo33
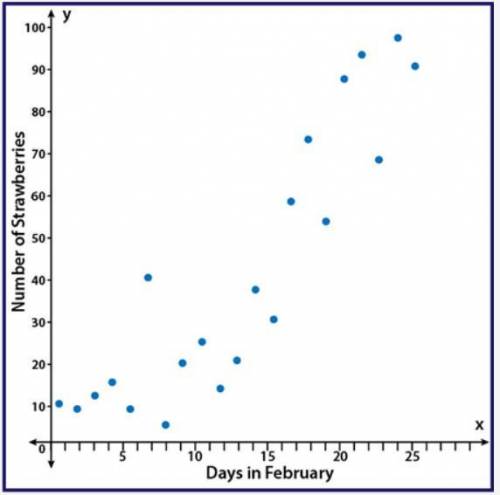
The scatter plot shows the number of strawberries that have been picked on the farm during the month of February:
A scatter plot with points showing an upward trend with points that are moderately spread out from a line of best fit. The y axis is labeled Number of Strawberries and the x axis is labeled Days in February
Part A: Using computer software, a correlation coefficient of r = 0.01 was calculated. Based on the scatter plot, is that an accurate value for this data? Why or why not? (5 points)
Part B: Instead of comparing the number of strawberries picked and the day in February, write a scenario that would be a causal relationship for strawberries picked on the farm. (5 points)

Answers: 3


Other questions on the subject: Mathematics
Mathematics, 21.06.2019 18:50, jen12abc82
The table represents a function f(x). what is f(3)? a.-9 b.-1 c.1 d.9
Answers: 1
Mathematics, 21.06.2019 22:50, rileyeddins1010
Aweekly newspaper charges $72 for each inch in length and one column width. what is the cost of an ad that runs 2 column inches long and 2 columns wide? its not 288
Answers: 1
Mathematics, 21.06.2019 23:00, serenityburke
The areas of two similar triangles are 72dm2 and 50dm2. the sum of their perimeters is 226dm. what is the perimeter of each of these triangles?
Answers: 1
You know the right answer?
The scatter plot shows the number of strawberries that have been picked on the farm during the month...
Questions in other subjects:
Mathematics, 11.02.2020 06:38
Mathematics, 11.02.2020 06:38

Mathematics, 11.02.2020 06:38
Mathematics, 11.02.2020 06:38

Biology, 11.02.2020 06:38

History, 11.02.2020 06:38
History, 11.02.2020 06:39

Chemistry, 11.02.2020 06:39


