
Mathematics, 11.02.2020 19:57 maria051002camp
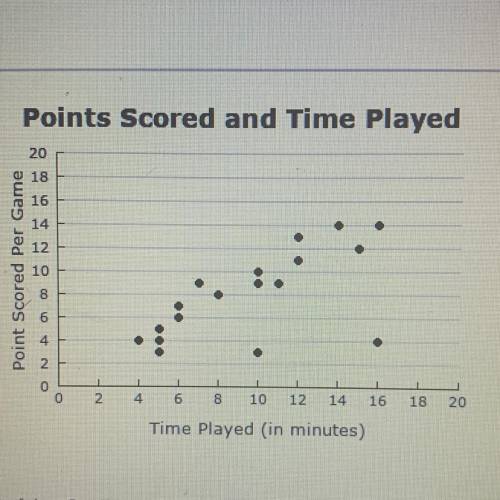
The scatter plot shows the amount of time Oscar played and the number of points he scored during each basketball game. Which describes the association of the variables in the data?
no association
nonlinear association
positive, linear association
negative, linear association

Answers: 3


Other questions on the subject: Mathematics
Mathematics, 21.06.2019 20:00, martinezjulio1976
Use the elimination method to solve the systems of equations. choose the correct ordered pair. 7x+4y=39
Answers: 1
Mathematics, 21.06.2019 20:10, sawyerharper
Which expression do you get when you eliminate the negative exponents of 4a^2 b^216a^-3 b
Answers: 3
Mathematics, 21.06.2019 20:30, Gabyngreen
What is the interquartile range of this data set? 2, 5, 9, 11, 18, 30, 42, 48, 55, 73, 81
Answers: 1
Mathematics, 21.06.2019 23:10, danielacortevpe3i66
12 3 4 5 6 7 8 9 10time remaining01: 24: 54which graph represents this system? y=1/2x + 3 y= 3/2x -1
Answers: 1
You know the right answer?
The scatter plot shows the amount of time Oscar played and the number of points he scored during eac...
Questions in other subjects:

Arts, 01.12.2020 21:10


Biology, 01.12.2020 21:10

History, 01.12.2020 21:10
Mathematics, 01.12.2020 21:10
Mathematics, 01.12.2020 21:10
Arts, 01.12.2020 21:10


