
Mathematics, 11.02.2020 19:30 zhvianna
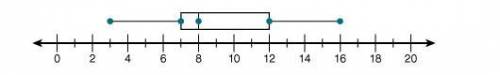
What is the interquartile range of the data represented in the following box-and-whisker plot?
20
13
5
4

Answers: 2


Other questions on the subject: Mathematics
Mathematics, 21.06.2019 17:20, organicmemez
Researchers were interested in whether relaxation training decreases the number of headaches a person experiences. they randomly assigned 20 participants to a control group or a relaxation training group and noted the change in number of headaches each group reported from the week before training to the week after training. which statistical analysis should be performed to answer the researchers' question?
Answers: 2
You know the right answer?
What is the interquartile range of the data represented in the following box-and-whisker plot?
Questions in other subjects:
Mathematics, 12.08.2020 06:01

Health, 12.08.2020 06:01


History, 12.08.2020 06:01


