
Mathematics, 11.02.2020 17:59 altstattlana
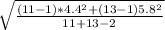
Two teaching methods and their effects on science test scores are being reviewed. A random sample of 11 students, taught in traditional lab sessions, had a mean test score of 76.1 with a standard deviation of 4.4. A random sample of 13 students, taught using interactive simulation software, had a mean test score of 87.1 with a standard deviation of 5.8. Do these results support the claim that the mean science test score is lower for students taught in traditional lab sessions than it is for students taught using interactive simulation software? Let µ1be the mean test score for the students taught in traditional lab sessions and µ2 be the mean test score for students taught using interactive simulation software. Use a significance level of α = 0.05 or the test. Assume that the population variances are equal and that the two populations are normally distributed. Step 1 of 4: State the null and alternative hypotheses for the test. Step 2 of 4: Compute the value of the t test statistic. Round your answer to three decimal places. Step 3 of 4: Determine the decision rule for rejecting the null hypothesis H0. Round your answer to three decimal places. Step 4 of 4: State the test's conclusion.

Answers: 1
 = mean test score for the students taught in traditional lab sessions.
 = mean test score for students taught using interactive simulation
  :
:  {Both traditional lab sessions and interactive
  :
:  {Students taught in traditional lab sessions has lower mean science test score than students taught using interactive simulation software}
 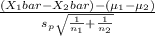 follows
 = 76.1 and
  = 87.1
 = 4.4 and
  = 5.8
= 5.8 = 46 and
  = 46
= 46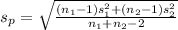 =
=  = 5.210
 follows


Other questions on the subject: Mathematics
Mathematics, 21.06.2019 17:30, samymaria1344
Lee has $1.75 in dimes and nickels. the number of nickels is 11 more than the number of dimes. how many of each coin does he have?
Answers: 1
Mathematics, 21.06.2019 18:20, genyjoannerubiera
17. a researcher measures three variables, x, y, and z for each individual in a sample of n = 20. the pearson correlations for this sample are rxy = 0.6, rxz = 0.4, and ryz = 0.7. a. find the partial correlation between x and y, holding z constant. b. find the partial correlation between x and z, holding y constant. (hint: simply switch the labels for the variables y and z to correspond with the labels in the equation.) gravetter, frederick j. statistics for the behavioral sciences (p. 526). cengage learning. kindle edition.
Answers: 2
Mathematics, 21.06.2019 22:20, maddy121209
The four students in the table below each recorded the time and distance traveled while exercising. exercising distance (miles) time (minutes) gia 2 30 harris 5 50 ian 3 40 jackson 4 80 which list ranks the students from fastest walker to slowest walker? jackson, gia, ian, harris harris, jackson, ian, gia harris, ian, gia, jackson jackson, harris, ian, gia
Answers: 3
You know the right answer?
Two teaching methods and their effects on science test scores are being reviewed. A random sample of...
Questions in other subjects:


Social Studies, 04.03.2021 08:20
Mathematics, 04.03.2021 08:20
Mathematics, 04.03.2021 08:20
Mathematics, 04.03.2021 08:20
Biology, 04.03.2021 08:20
Mathematics, 04.03.2021 08:20


