YOU DO NOT UNDERSTAND HOW MANY TIMES I HAVE POSTED THIS
The scatter plot shows the number of p...

Mathematics, 11.02.2020 00:35 madisonsolis05
YOU DO NOT UNDERSTAND HOW MANY TIMES I HAVE POSTED THIS
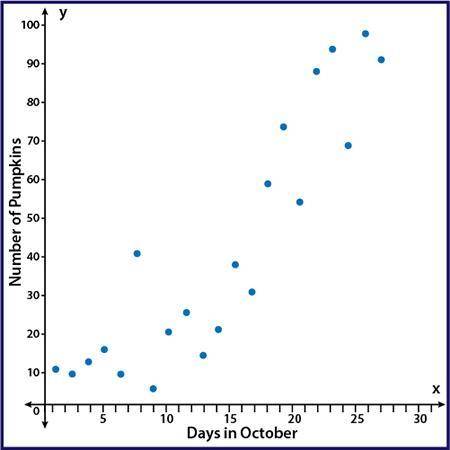
The scatter plot shows the number of pumpkins that have been picked on the farm during the month of October:
A scatter plot with points showing an upward trend with points that are moderately spread out from a line of best fit. The y axis is labeled Number of Pumpkins and the x axis is labeled Days in October
Part A: Using computer software, a correlation coefficient of r = 0.51 was calculated. Based on the scatter plot, is that an accurate value for this data? Why or why not? (5 points)
Part B: Instead of comparing the number of pumpkins picked and the day in October, write a scenario that would be a causal relationship for pumpkins picked on the farm. (5 points

Answers: 1


Other questions on the subject: Mathematics
Mathematics, 21.06.2019 23:00, lejeanjamespete1
Graph the system of equations. {6x−4y=−244x−8y=−32 use the line tool to graph the lines.
Answers: 1
Mathematics, 22.06.2019 03:00, lilagvaldez15
What is the location of maximum over the interval [-3,1.5] for the graphed function?
Answers: 1
You know the right answer?
Questions in other subjects:

Mathematics, 27.10.2020 01:00


Mathematics, 27.10.2020 01:00
Mathematics, 27.10.2020 01:00


