I HAVE POSTED THIS SO MANY TIMES AND NO ONE HAS HELPED ME
The scatter plot shows the num...

Mathematics, 11.02.2020 00:17 deku6
I HAVE POSTED THIS SO MANY TIMES AND NO ONE HAS HELPED ME
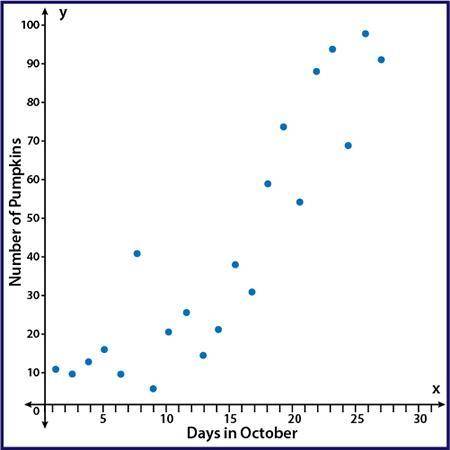
The scatter plot shows the number of pumpkins that have been picked on the farm during the month of October:
A scatter plot with points showing an upward trend with points that are moderately spread out from a line of best fit. The y axis is labeled Number of Pumpkins and the x axis is labeled Days in October
Part A: Using computer software, a correlation coefficient of r = 0.51 was calculated. Based on the scatter plot, is that an accurate value for this data? Why or why not? (5 points)
Part B: Instead of comparing the number of pumpkins picked and the day in October, write a scenario that would be a causal relationship for pumpkins picked on the farm. (5 points

Answers: 2


Other questions on the subject: Mathematics
Mathematics, 21.06.2019 15:00, lexibyrd120
Explain why the function is discontinuous at the given number a. (select all that apply.) f(x) = 1 x + 1 a = −1 f(−1) is undefined. lim x→−1+ f(x) and lim x→−1− f(x) exist, but are not equal. lim x→−1 f(x) does not exist. f(−1) and lim x→−1 f(x) exist, but are not equal. none of the above
Answers: 3
Mathematics, 21.06.2019 19:00, garciagang0630
[15 points, algebra 2]simplify the complex fraction and find the restrictions.
Answers: 1
Mathematics, 21.06.2019 20:00, hlannette7005
Segment an is an altitude of right δabc with a right angle at a. if ab = 2, squared 5 in and nc = 1 in, find bn, an, ac.
Answers: 2
You know the right answer?
Questions in other subjects:
Mathematics, 16.09.2019 04:30

History, 16.09.2019 04:30


Biology, 16.09.2019 04:30


